PeakSimpleBasicTutorial
Version4.17, September 2012
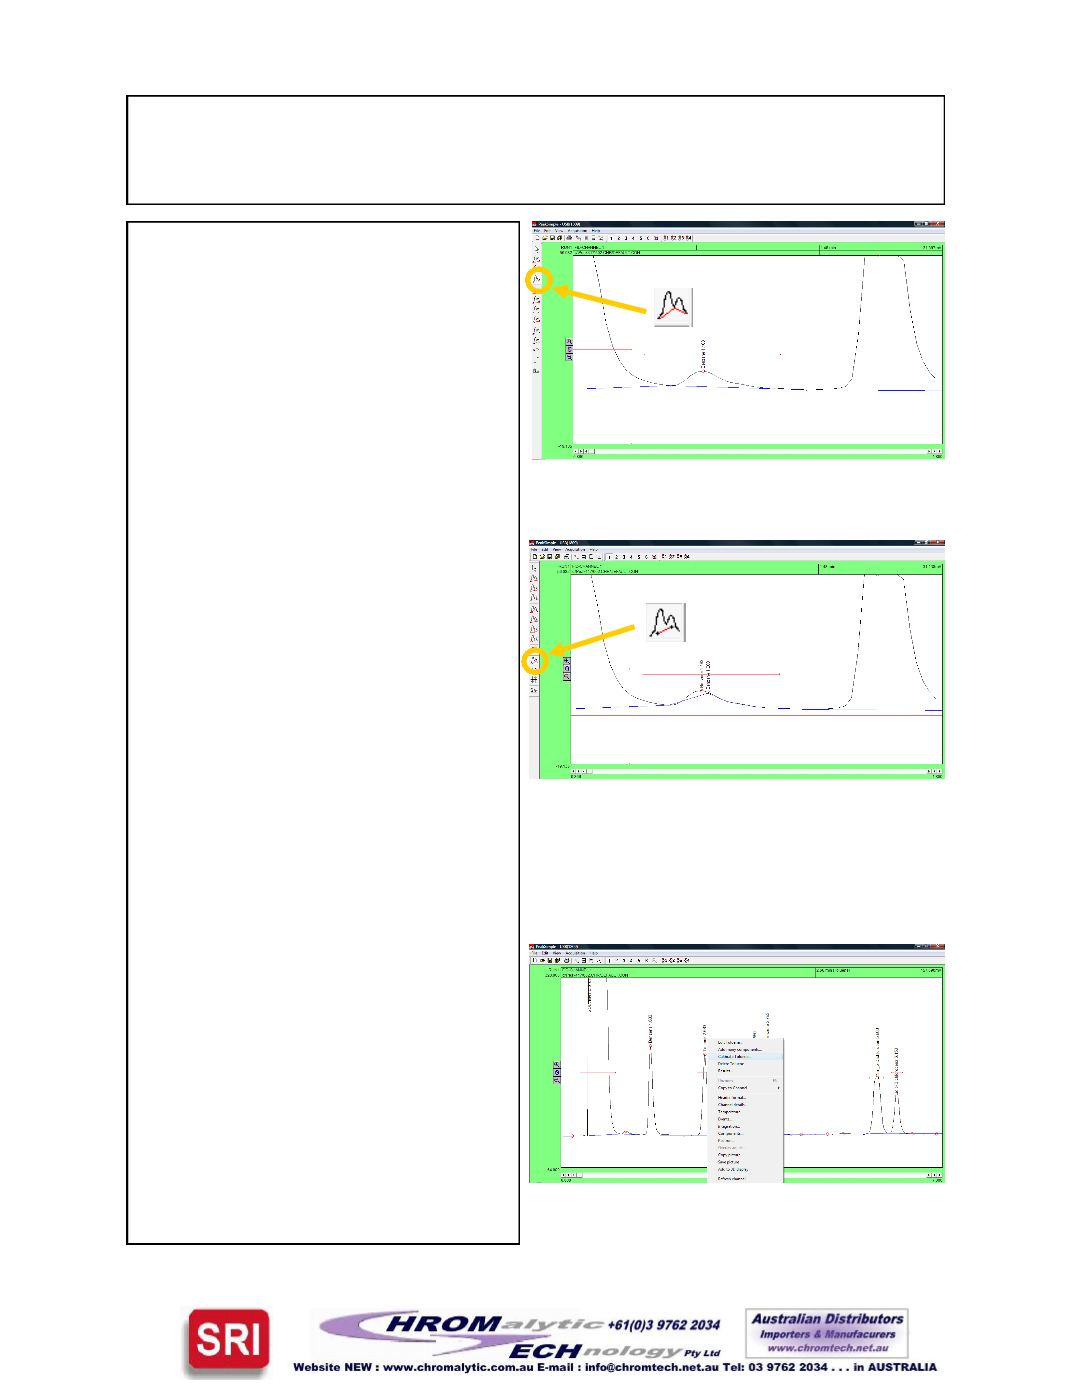
6. After themanual integrationbetween
the two peaks is dropped use the
Based
integration tool to raise the
baseline to the valley between the
peaks. Once theBased integration
tool is selected, clickon the valley be-
tween the solvent peak and the
smaller peak to its right with the
mouse cursor. Thebaselinewill now
extend up tomeet the valley of the
two peaks.
7. Once again click on the
Undo
tool in
themanual integration toolbar to re-
move all changes done to the chroma-
togram. Select the
RubberBand
inte-
gration tool tomanually drawa base-
line.Once theRubber Band tool is se-
lected take themouse cursor and click
on a part of the baseline.While hold-
ingdown the left mouse button extend
the line toanother part of the baseline
further to the right of the starting point
and let goof themouse button. The
base linewill nowbe drawn according
to the line that was drawn using the
Rubber Band integration tool.
Calibration
1. To turn the rawareaof a peak intoa
real-world number the peak first
needs tobe calibrated. To calibrate
theToluene peak in chromatogram
602.CHR, openup the file and then
right click using themouse on the
Toluenepeak. After right clicking on
Toluene select
CalibrateToluene
from the resultingmenu.
Page7


