PeakSimpleBasicTutorial
Version4.17, September 2012
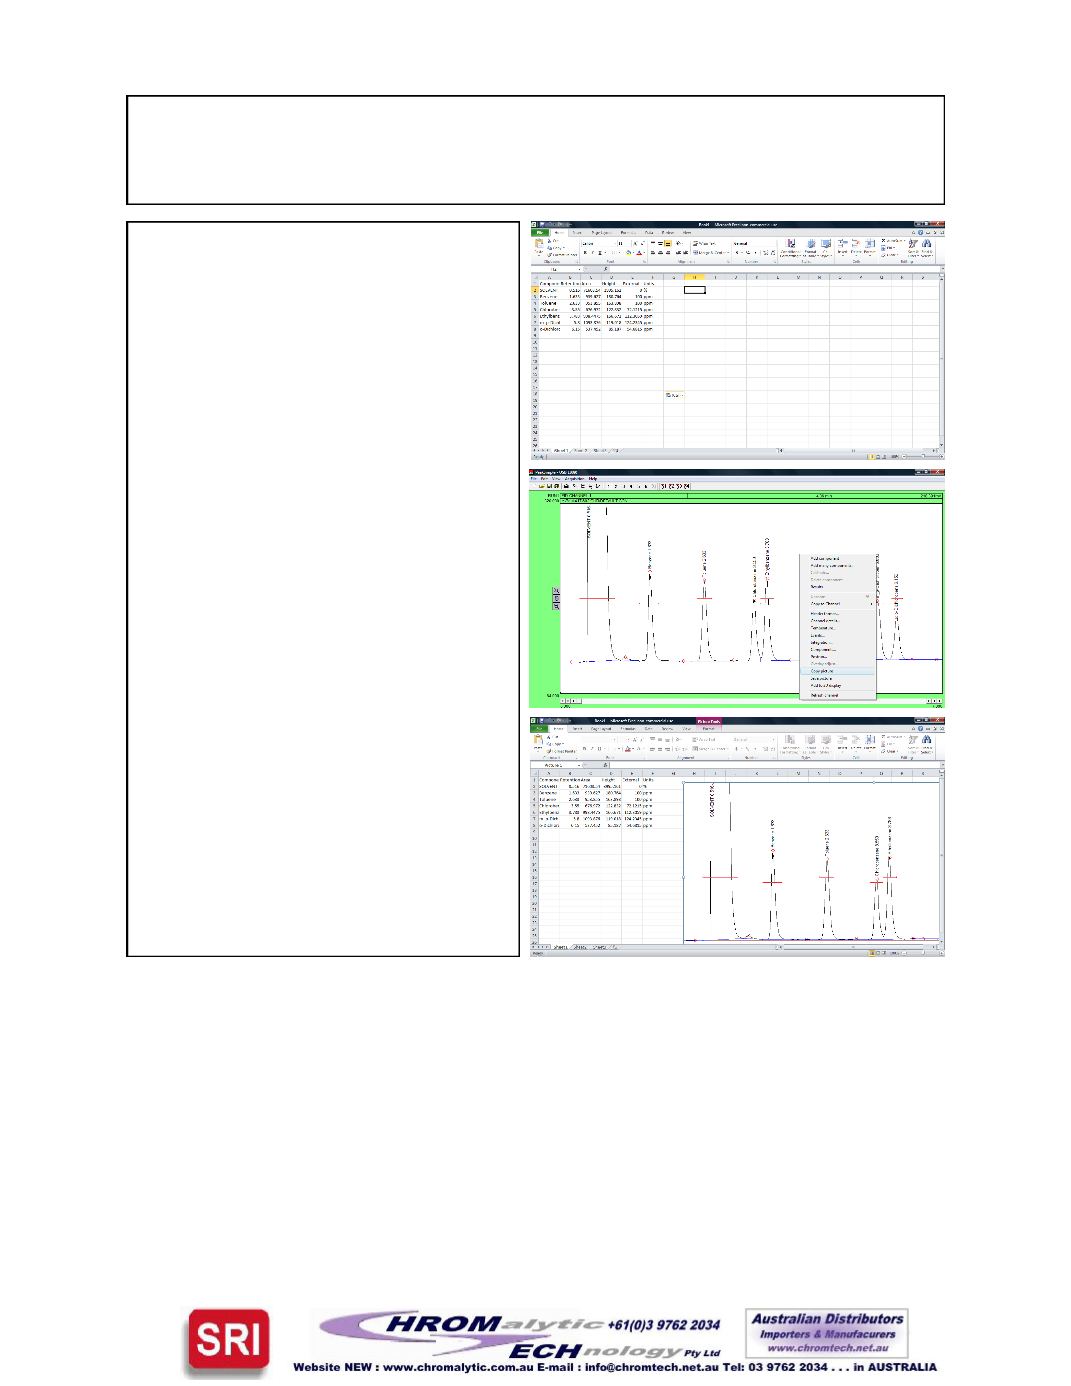
3. OnceExcel is opened select
Edit
from theExcel menu bar and then
Paste
from the dropdownmenu. The
results data is nowplaced into the col-
umns and rows of Excel. Using the
mouse cursor, select a box to the right
of the results data in theExcel
spreadsheet. Goback into thePeak-
Simple programand hit
Close
to exit
theResultswindow.
4. Right clickwith themouse cursor any-
where on chromatogram602.CHR
and select
Copypicture
from the re-
sultingmenu. Go back intoExcel and
select
Edit
from theExcel menu bar
and then
Paste
from the drop down
menu. ThePeakSimple chroma-
togramwill nowbe displayed next to
its results data in the rows and col-
umns of Microsoft Excel.
Page12
This concludes thePeakSimpleBasicTutorial.
AnAdvancedTutorial can beobtained bygoing to:
If youhave questions or would like to place an order, call:


