PeakSimpleCalibrationTutorial
August 2008
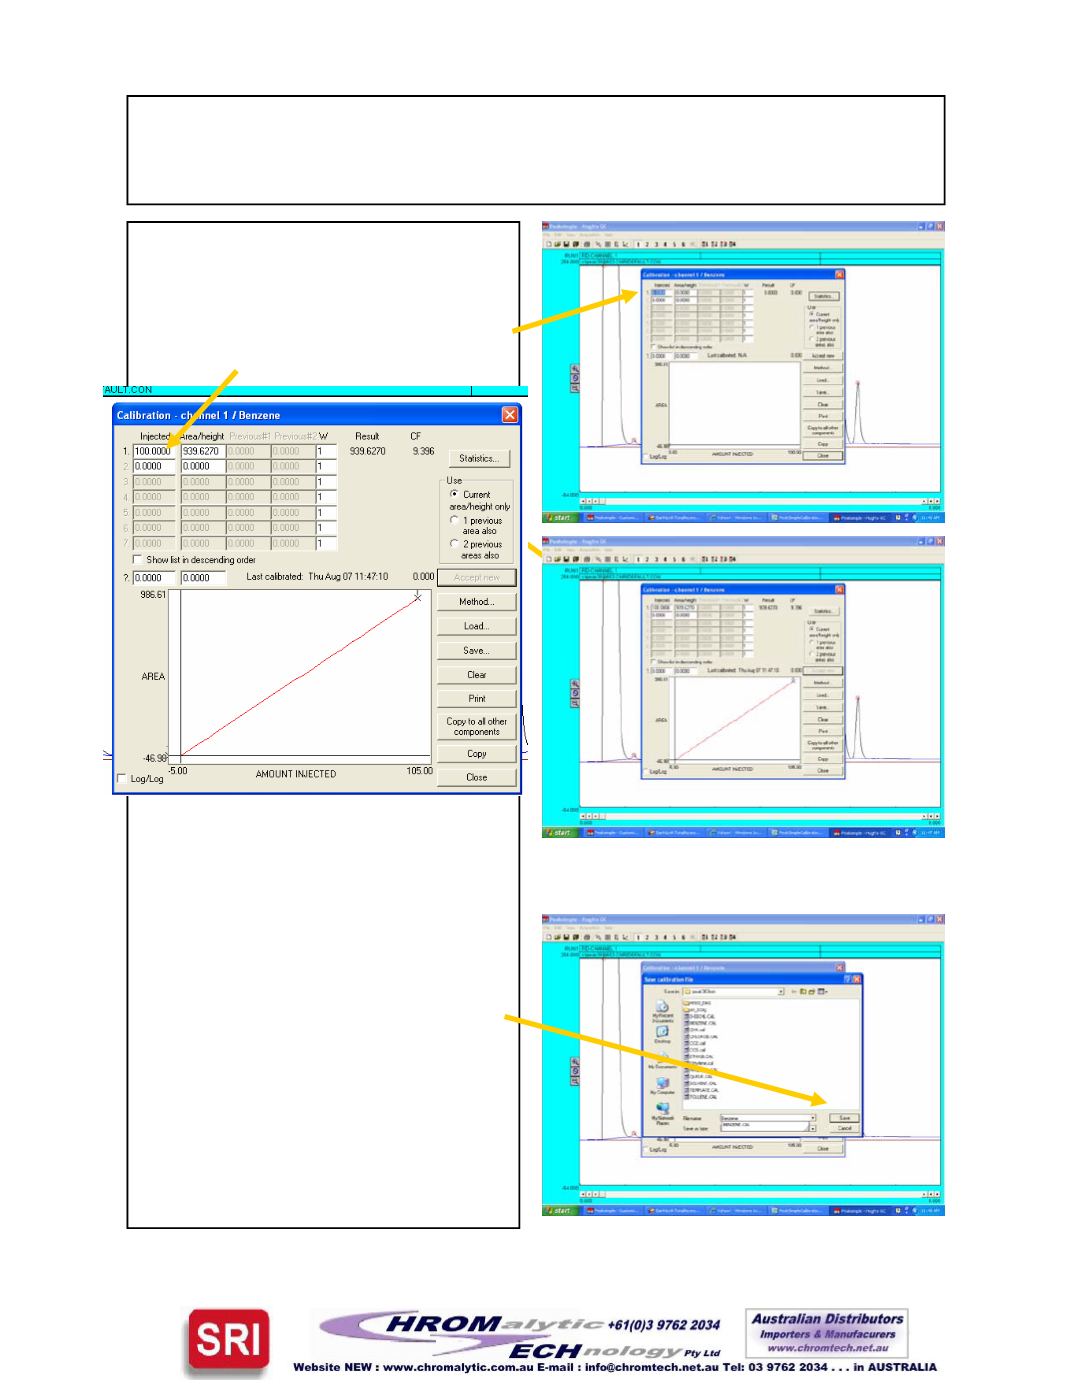
This takes you to the blank calibration
curve.
Enter the amount of Benzene injected in
the top left cell of the spreadsheet
Then click theAccept New button. The
peak area for theBenzene peak is then
automatically inserted into the adjacent
cell in the spreadsheet. The graph is
also drawn on the screen.
Save the calibration curve by clicking the
Save button and then entering a name
for the calibration curve. Benzene.cal
would be a logical choice but any name
isOK. Then click theClose button.
Once youhavenamed the calibration
curve it is savedAUTOMATICALLY
when you exit the calibration curve
screen, so youdonot have toSave
each time.
Page5


