7
This freedup theAdsorbent Tube Injector to spike thenext tube
of the series by using the Dynatherm conditioner. After the
desiredchallengevolumehadelapsed, the tubeswere removed
and loaded into theTDSA thermaldesorber.Asequencewasset
toanalyze the tubesovernight.Weanalyzedeach tube indepen-
dently, and the results compared to a calibration curve.
CalibrationProcedures for theAnalytical System
It was not feasible to make syringe injections of liquid or gas
standards directly onto the column for two reasons. First, the
transfer lineof theGERSTELTDSAconnectsdirectly to the inlet
by a fitting that replaces the septum port. Second, the large
volumeof the testmixcouldnotbe injectedquantitatively. It isnot
practical to inject a20mL syringe volumeof the test gas directly
on toacapillarycolumnwithout altering the flowdynamicsof the
GC system.
Therefore, themodelwechose todetermine the recoverywas to
spike thesame20mLsyringevolumeof the testmixontoamulti-
bedCarbotrap300using thesame techniqueasperformed in the
previoussection.Thegasmixwassweptonto theCarbotrap300
tube with a total volume of 0.2 Liters using with the Adsorbent
Tube Injector. Thiswas enough volume to sweep theentiregas
mix onto the tube, but would not pose a challenge to the
combined adsorbents of thismulti-bed tube. With such a small
sample transfer volume (200mL), no loss of any analyte was
expected.Weassumed100% recovery from theCarbotrap300.
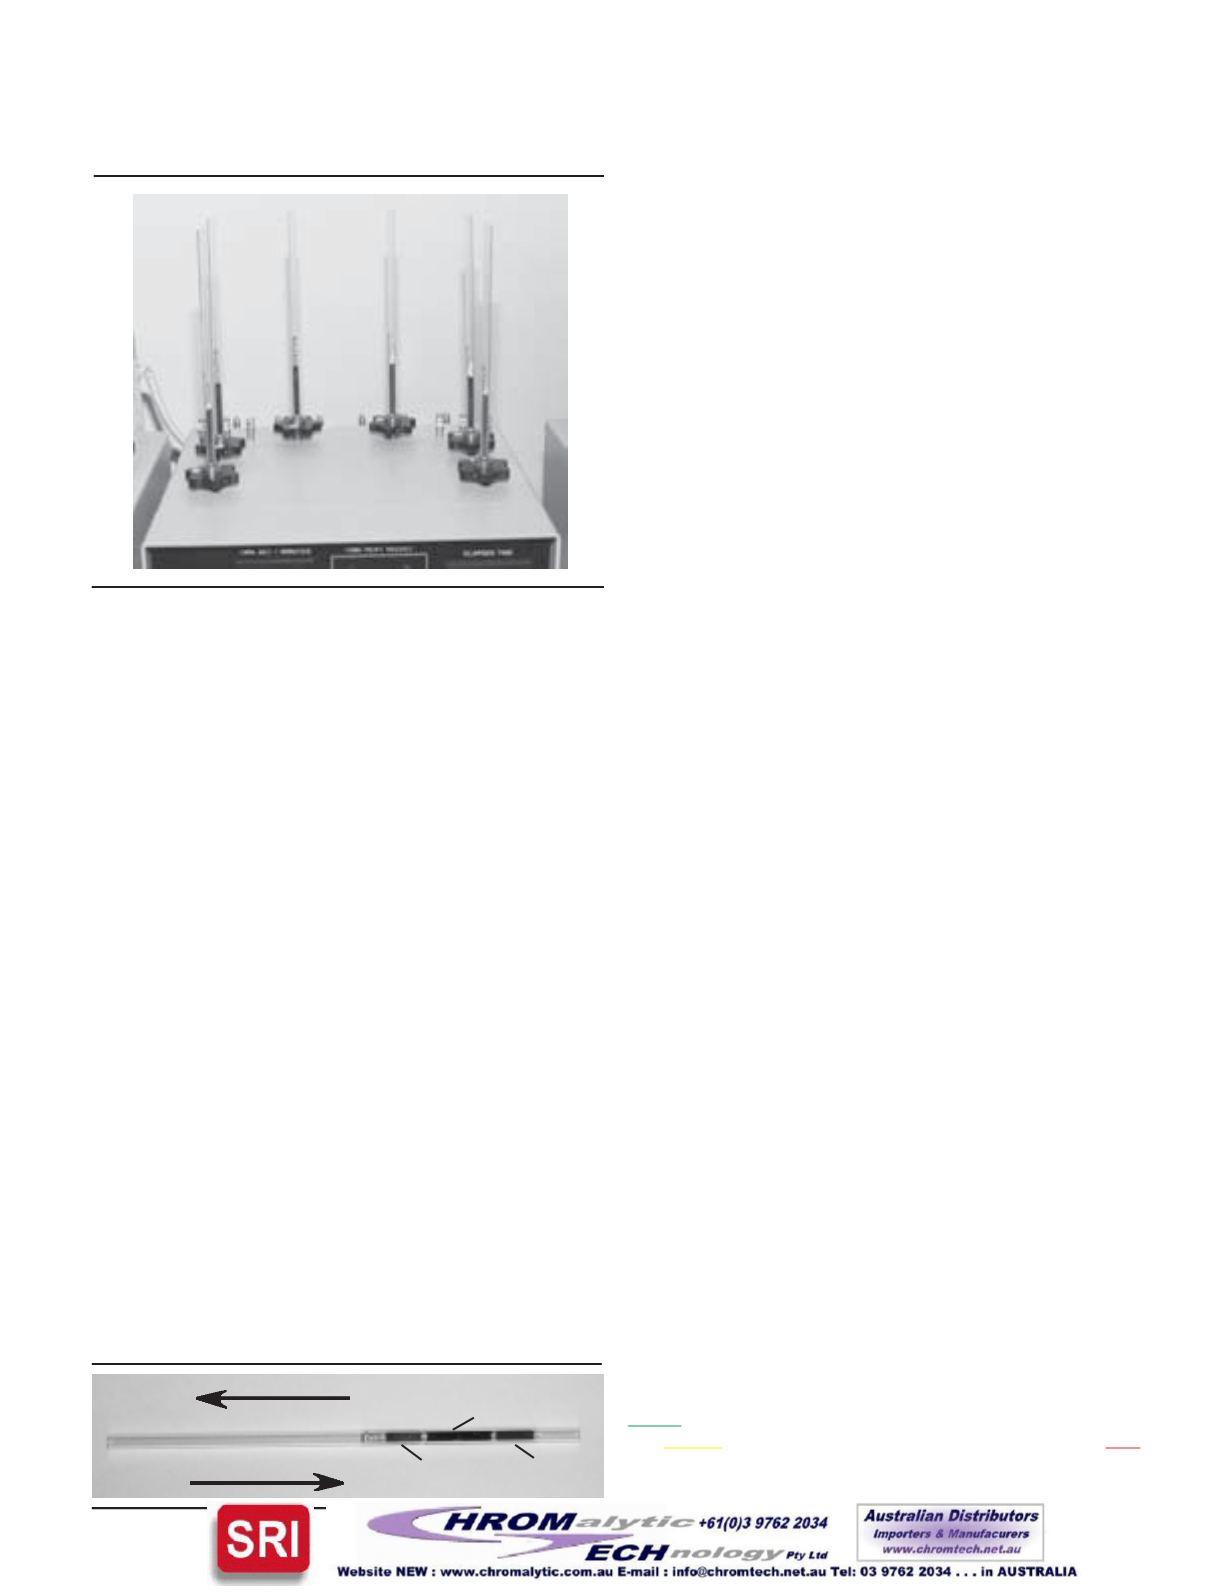
Figure 7
illustrates the flow direction we used to sample and
desorb the collected analytes.
Figure6. DynathermSix-TubeConditionerwith the
Tubes In-PlaceDuring theVolumeChallenge
Figure7. Pictureof theCarbotrap300Tube
Used for theCalibration
ChallengeFlowDirection
DesorptionFlowDirection
CarbosieveS-III
CarbopackB
CarbopackC
Constructing theCalibrationCurve
Six analytical runs made up the single-point curve for each
series. For each challenge volume (set) a Carbotrap 300 tube
was spikedwith the same 20mL syringe volume of the test mix
andanalyzedalongwith theadsorbentsof thatseries.Wecopied
the actual responses from the analysis directly into Microsoft
®
Excel. We set up a spreadsheet template to perform all the
recoverycalculations.Weaveraged theanalyte responses from
these six calibration runs and divided them by 100 to calculate
the average response factor for each analyte. We then consid-
ered the response factors as themodel of 100% percent recov-
ered.We createda separate calibration curve for each seriesof
adsorbents tested.Thisprocedure reduced theeffect of detector
drift over time, since thecompletionof the research tookseveral
months.
Calculating theRecoveryof theFirstDesorption
We divided the analyte response from each adsorbent by the
average response factor derived from the calibration curve
(above) and multiplied it by 100%. The result was the percent
recovered from the adsorbent.
We identified the analytes using the primary and secondary
quantitation ions of each analyte. The primary ion was used to
determine the area response of each analyte. (See
Table 2
for
the primary and secondary ions used in this research.)
Calculating theRecoveryof theSecondDesorption
Eachadsorbent tubewas re-desorbedat the same temperature
immediately following the primary desorption of each series of
adsorbents. Ifwe foundanyof theanalytes from the test, then the
recoverywasdetermined.This information is important because
if theanalyte(s)cannotbeefficiently released from theadsorbent
during the primary desorption then either the analyte is too
stronglyadsorbedor irreversiblyadsorbed.Thedifference is that
“toostronglyadsorbed
“means thatadsorbentretains theanalytes
to the point that they are not efficiently released from the
adsorbent duringdesorptionandaportionof it canbeobserved
in the second analysis.Where as, “
irreversible adsorption”
indi-
cates theanalytecannot be released from theadsorbent, and is
not observed in the second analysis.
Regardless of whether the adsorbent retains the analyte too
strongly or irreversibly adsorbs it; the user should choose a
different adsorbent for that analyte. In an effort to help users
choose the right adsorbent the performance charts include this
(*)symbol next to theanalytename ifweobservedmore than5%
of thatanalyte in thesecondanalysis.Thisallowsusers toquickly
observe which analytes they should not sample with certain
adsorbents.
Results:How toUse theCharts
To simplify the use of the reams of data generated by this
researchwe developed a simple scheme so users can visually
see the recovery basedon color rather than comparingmultiple
columns of numbers. We used the analogy of a traffic signal to
display the results.Theperformancechartsarecolor-coded,with
Green
indicating the recovery is greater than or equal to 80%.
The
Yellow
indicates the recovery isbetween21and79%.
Red
indicates the recovery is less than or equal to 20%. Using the
feature of “conditional formatting” in the Excel program, we
displayed the raw data by color instead of displaying the actual


