8
values. Thisconceptmakes it easier tocompare theadsorbents
when you view the charts together.
Recoveries of 80% or greater are typically considered accept-
able inmost thermal desorptionmethods. Recoveries between
21 and 79% indicates a significant amount of the analyte was
recovered from the adsorbent, but warns the user that break-
through occurred or that the analyte is too strongly retained. A
recoveryof less than20% issimplynot suitable foranysampling
application.
Theperformance charts allow theuser to see the relativediffer-
encesbetween theadsorbentsandassists them in choosingan
adsorbent that will retain the analytes of interest at a specific
volume. Youcanalsouse thesecharts tochooseacombination
of adsorbents to construct amulti-bed tube, which can retain a
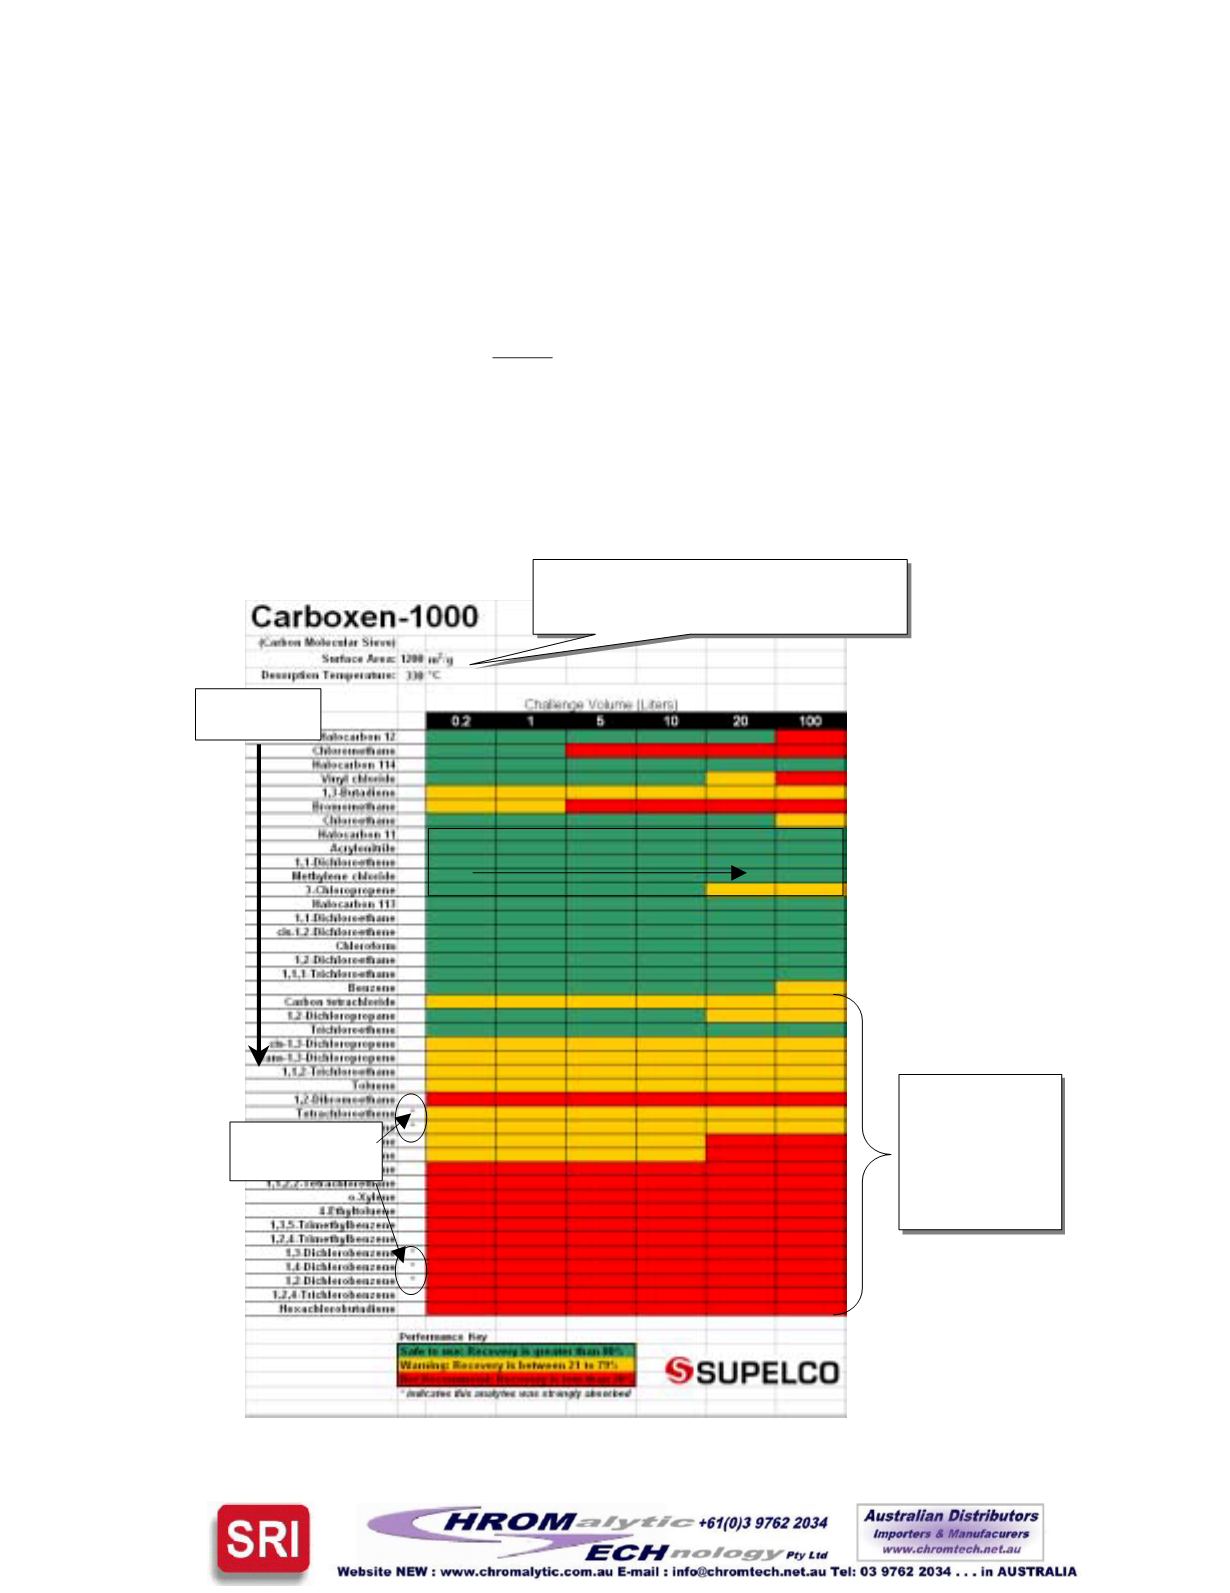
Data pertinent to each adsorbent can
be found here
IncreasingVolume
TooStrongly
Retained
When sampling
for these
analytes—a
weaker adsorbent
should be placed
in front of this
adsorbent
BoilingPoint
Increases
wide rangeof analytes.Theperformancecharts illustrate that no
one single adsorbent can retain and release the entire list of
analytes.
The best way to use the performance charts is to look for the
trends of green color for the analytes of interest. As seen in the
example chart below, the recoveries of most of the very volatile
analytes aregood. As the challenge volume increases, someof
the recoveries decreased due to the analytes breaking through
the adsorbent. In respect to this example (Carboxen-1000),
when sampling for analytes that have higher boiling points,
greater thanBenzene, you should use aweaker adsorbent bed
in front of thisadsorbent. This isbecause theanalytesareeither
too strongly adsorbed (denoted by the asterisk * symbol), or
irreversibly adsorbed


