Operating theSRI Mudlogger GC configuration
The 5
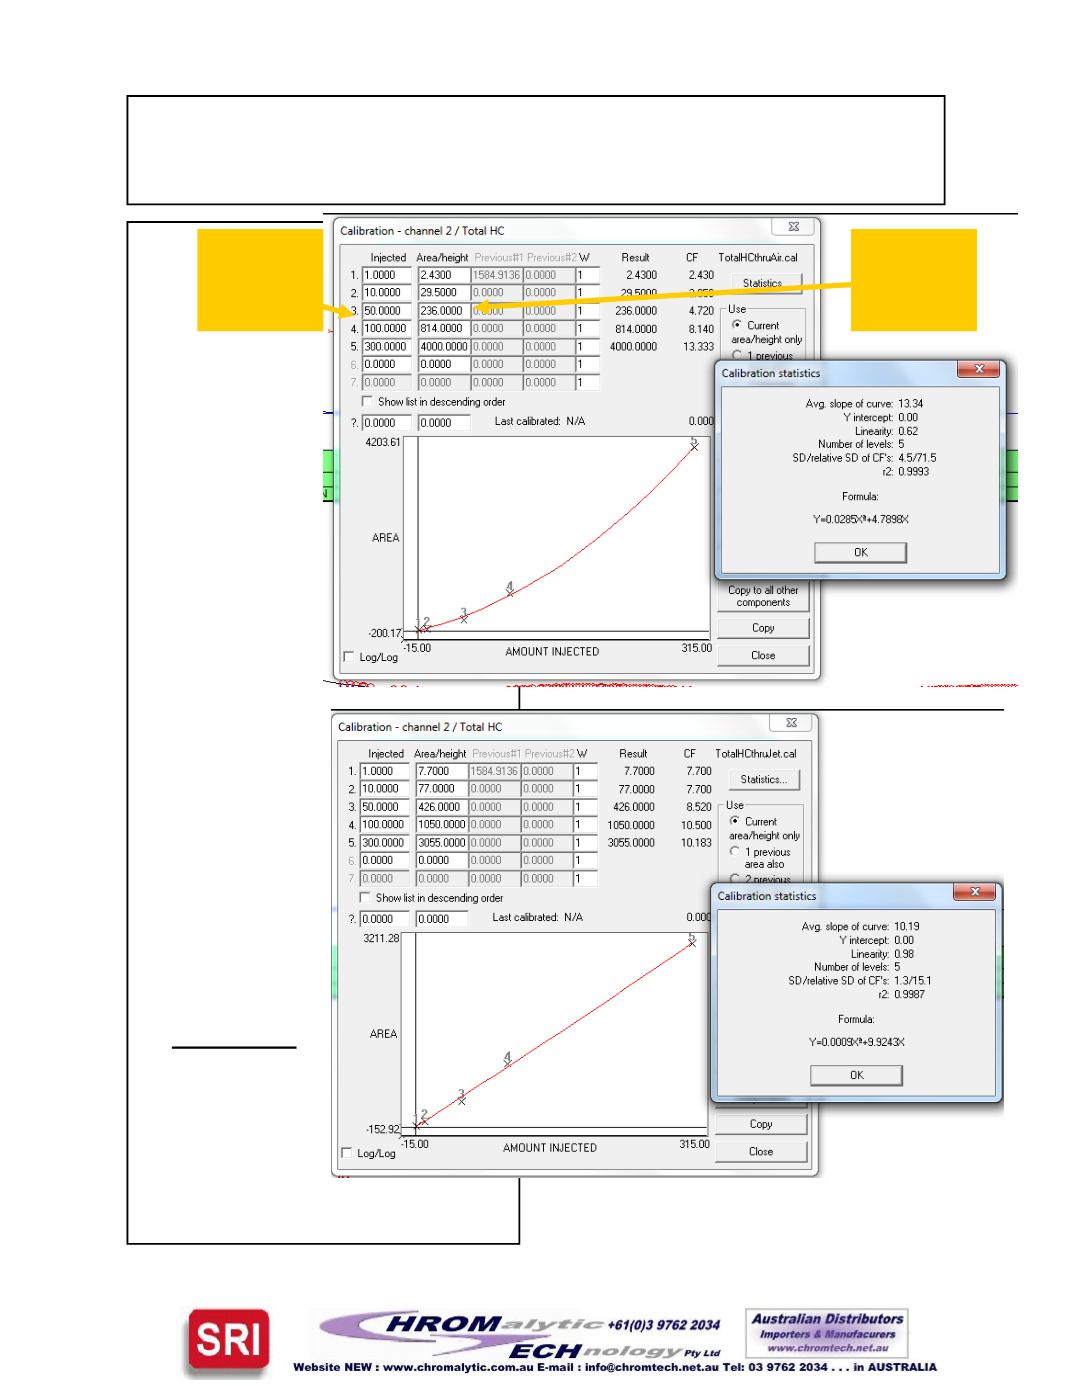
point curve at right
shows theTotal-
Gas response ( in
millivolts ) when the
sample is intro-
duced through the
air supply to the
FID. Because of
the non-linearity, a
quadratic curve
was used. Methane
gaswith concentra-
tions of 1%, 10%,
50%, and100%
were supplied to
theGC. Propane
was supplied for the
300% level.
This curve shows
the same gases in-
troduced through
theFID jet. The
linearity is better
through the jet so a
straight line fit is
used.
It is
IMPORTANT
that the needle
valve be adjusted so
that 100%methane
equals 1000mil-
livolts onmedium
gain. If the signal is
higher then the linearitywill beworse,
Page6
This shows
theSwagelok
cap fitting.
Methane con-
centration
( 1,10,50,100
and300%
FID signal in
millivolts


