Operating theSRI Mudlogger GC configuration
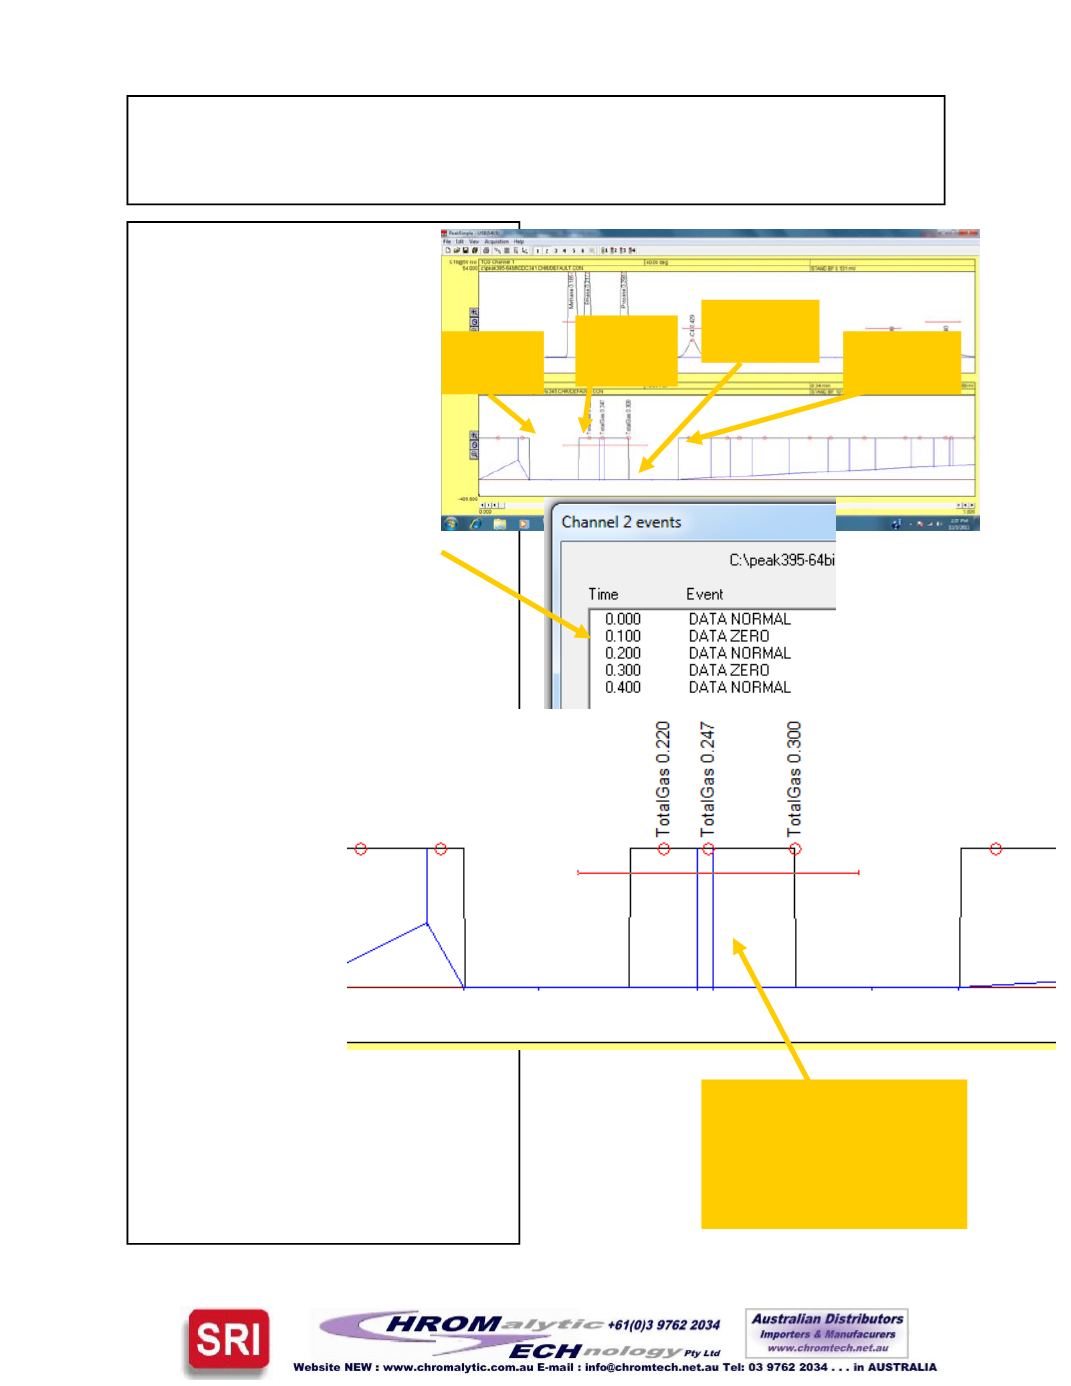
As shown at right, theTotal
Gas signal is plotted on
channel 2. In this case the
samplewas 100%methane
which resulted in a signal
level of 1000millivolts.
As instructed by theEvent
table, at .1minutes the sig-
nal was forced to 0miliivolts.
At .2minutes the signal returns to
1000mv.
At .3minutes the
signal is forced to
zeroagain.
At .4minutes the
signal is allowed to
return to1000mv.
The effect is to
create a square
shaped peak
which can be cali-
brated just like any
other peak.
Page10
Force sig-
nal to0.00
Signal re-
turns to
1000
Force signal
to0.00again
Signal back
to1000again
Square shaped peak
whose area is propor-
tional to the signal level


