SRI 8610CGasChromatograph
MultipleGas #3GC configuration
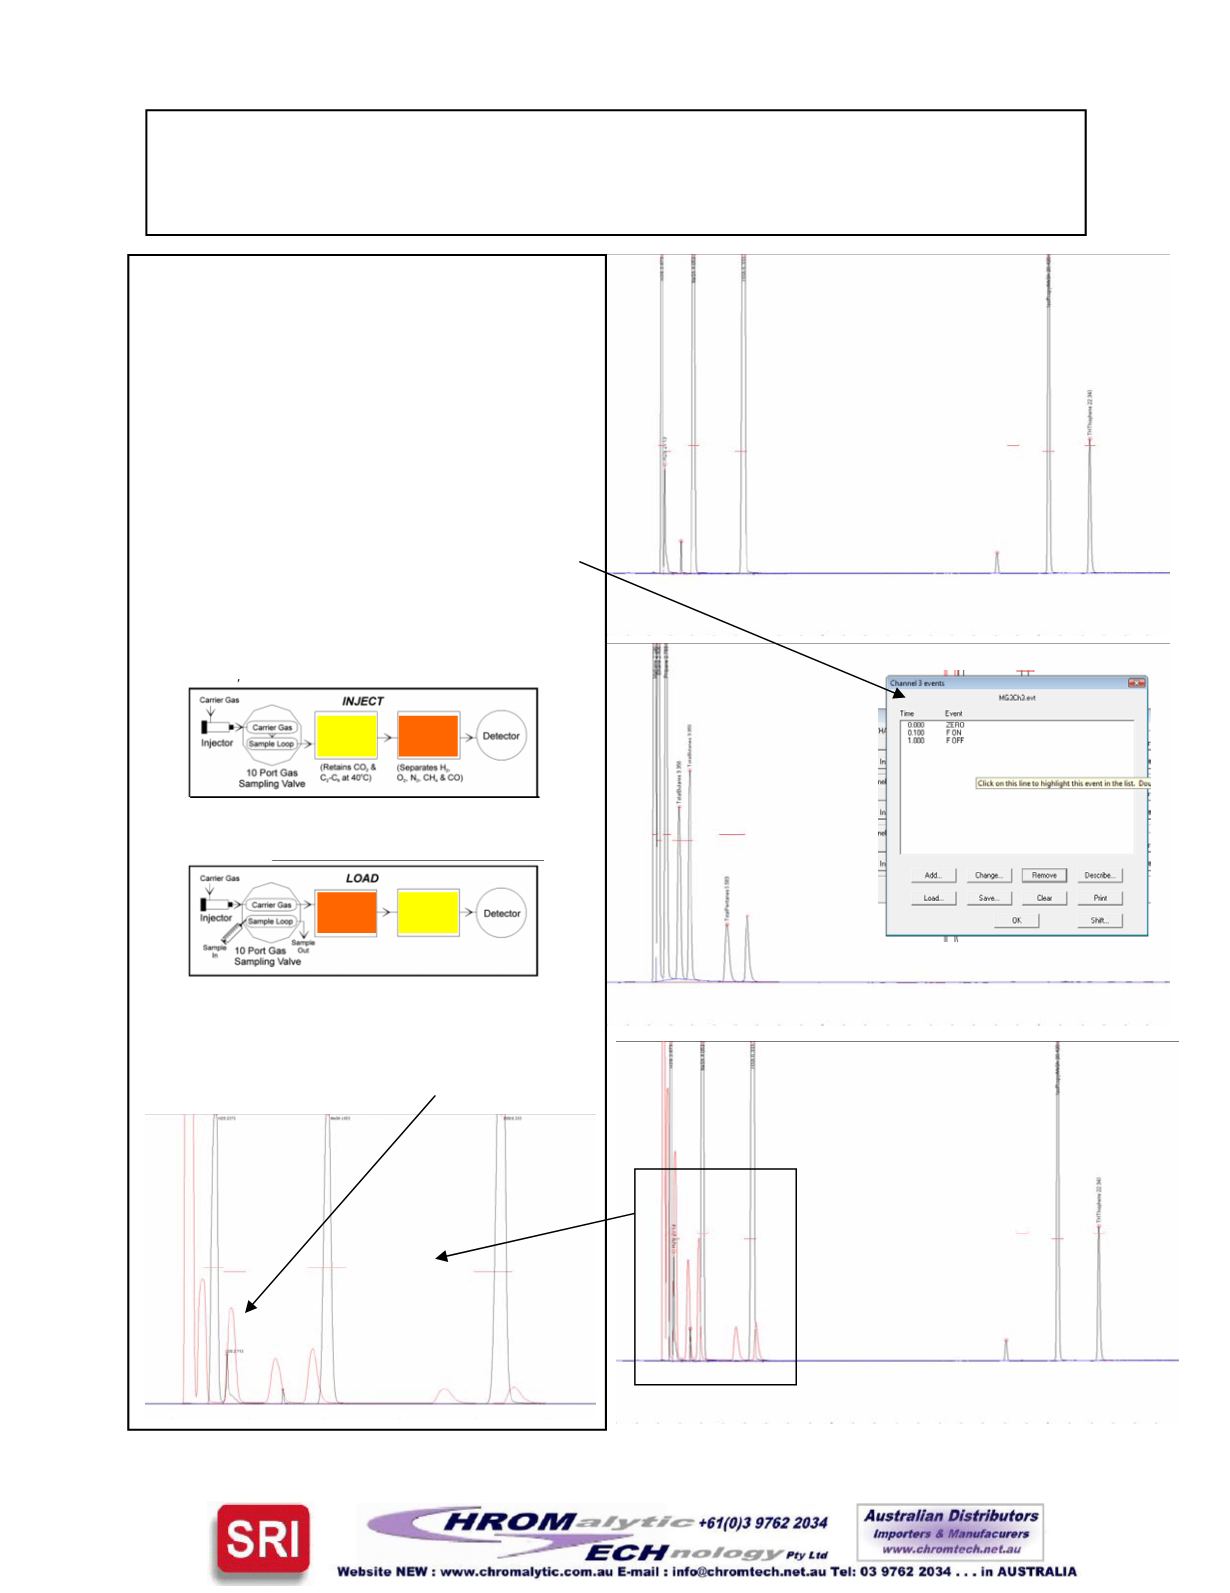
The chromatograms shown on this page are a
mix of natural gas and sulfur compounds. The
top chromatogram shows the sulfur selective
FPD response.
Themiddle chromatogram shows theFID re-
sponse.
The two lower chromatograms show theFPD
response ( black ) overlaidwith theFID re-
sponse ( red ).
ThePeakSimple event table shownat right ro-
tates the valve from Load to Inject at .1min-
utes and then back to Load at 1.00minutes.
Because even the first peak (methane ) has
not migrated fromColumn 1 though toColumn
2 at this time, the equivalent effect is that the
peaks are injected into and are separated by
Column 1 only, as if Column 2was not even
connected. You can seeby the overlaid chro-
matograms that COS co-eluteswithPropane
quenching its FPD response.
MultiGas#3
Instructions
Page2
Col 1
Col 2
Col 1
Col 2
FPD
Sulfur only
FID
Hydrocarbons
FPDandFID
overlaid
Just this section
enlarged
Column1 60meter
MXT1 .53mm 5mic.
Column2 15meter
RTXQ-Plot .53mm


