Expected Performance
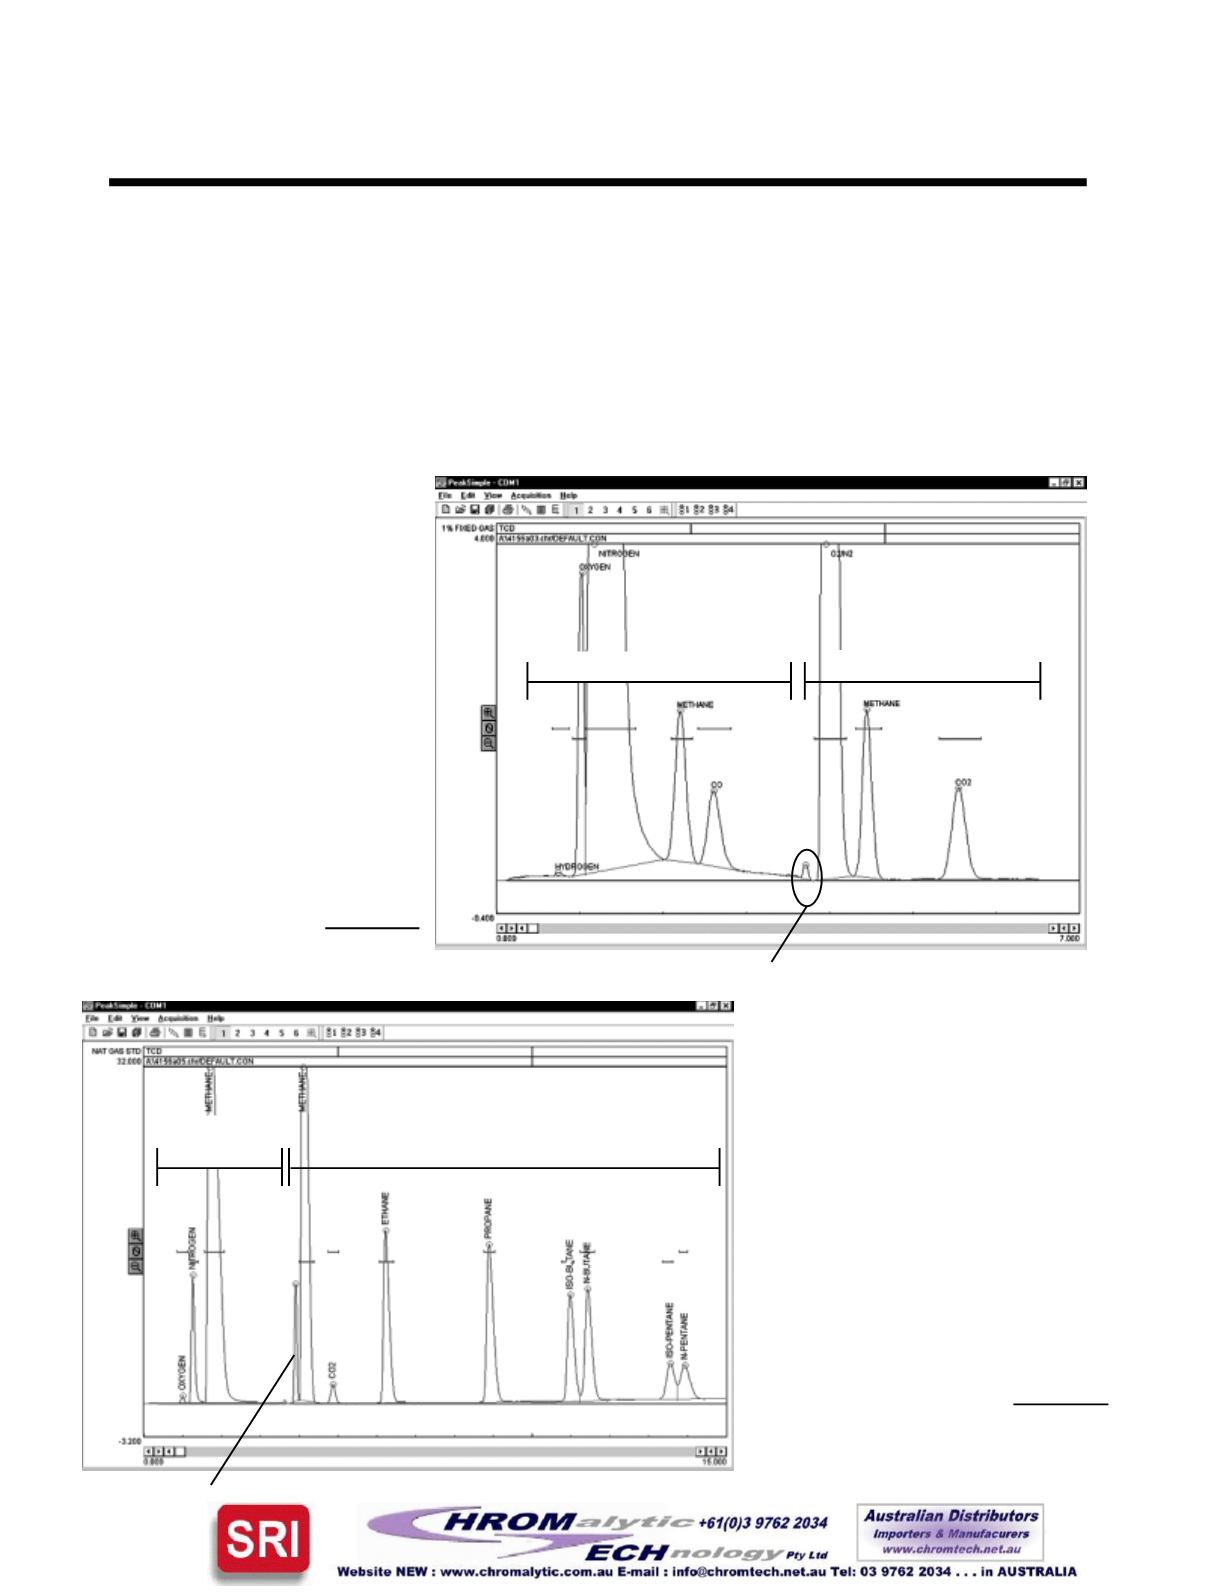
1% FixedGas Standard
Thefirstchromatogramshows theTCDresponse toa1%FixedGasStandardsample. Using thesame
valvetemperature,columnoventemperatureprogram,carrierflowandeventtable, thesecondchromatogram
shows theTCD response toaNaturalGasStandardsample. Theevent tableused isshownon the
General
OperatingProcedurecontinued
page.
Natural Gas Standard
POPULAR CONFIGURATION GCs
Multiple Gas Analyzer #2
Columns:2-meterHayesep-D,2-meter
MolecularSieve13x
TCDcurrent=LOW;TCD temp=150
o
C
Carrier:Heliumat40mL/minutecombined
(20mL/minute througheachcolumn)
Valve temp=90
o
C
ColumnOven
Temperatureprogram:
Initial
Hold Ramp Final
50
o
C 3.00 20.00 220
o
C
220
o
C 25.00 0.00 220
o
C
RESULTS:
Component
Retention
Area
OxygenMS
0.983
3.4190
NitrogenMS
1.250
72.5450
MethaneMS
1.683
706.7920
MethaneHay-D 4.083
587.7140
CO
2
Hay-D
4.850
14.7710
Ethane Hay-D 6.216
169.1275
Propane Hay-D 8.866
180.2660
Iso-Butane Hay-D 10.966
126.6950
N-Butane Hay-D 11.400
134.1470
Iso-Pentane Hay-D 13.533
50.1540
N-Pentane Hay-D 13.916
54.4740
TOTAL 2099.1045
Carrierswitch
MolecularSieve13xcolumn
Hayesep-Dcolumn
RESULTS:
Component
Retention Area
HydrogenMS 0.733 00.2510
OxygenMS 1.016 16.0495
NitrogenMS 1.166 1108.7680
MethaneMS 2.200 16.5050
COMS
2.600 09.7370
O
2
/N
2
Hay-D 3.950 863.6340
MethaneHay-D 4.433 15.7300
CO
2
Hay-D 5.533 12.9205
TOTAL
2043.5950
Carrierswitch
Molecular
Sievecolumn
Hayesep-Dcolumn


