elution slice (i.e.
i
i
i
w
height
height
å
=
, columns D andM respectively).
w
M
was obtained by
multiplying
i
w
and
i
M
and summing the appropriate columns (see bottom of columns E and N)
n
M
1 was obtained by dividing each
i
w
by
i
M
and summing the appropriate columns (see
bottom of columns F and O). Thus, the molecular weight averages for the two polymers were
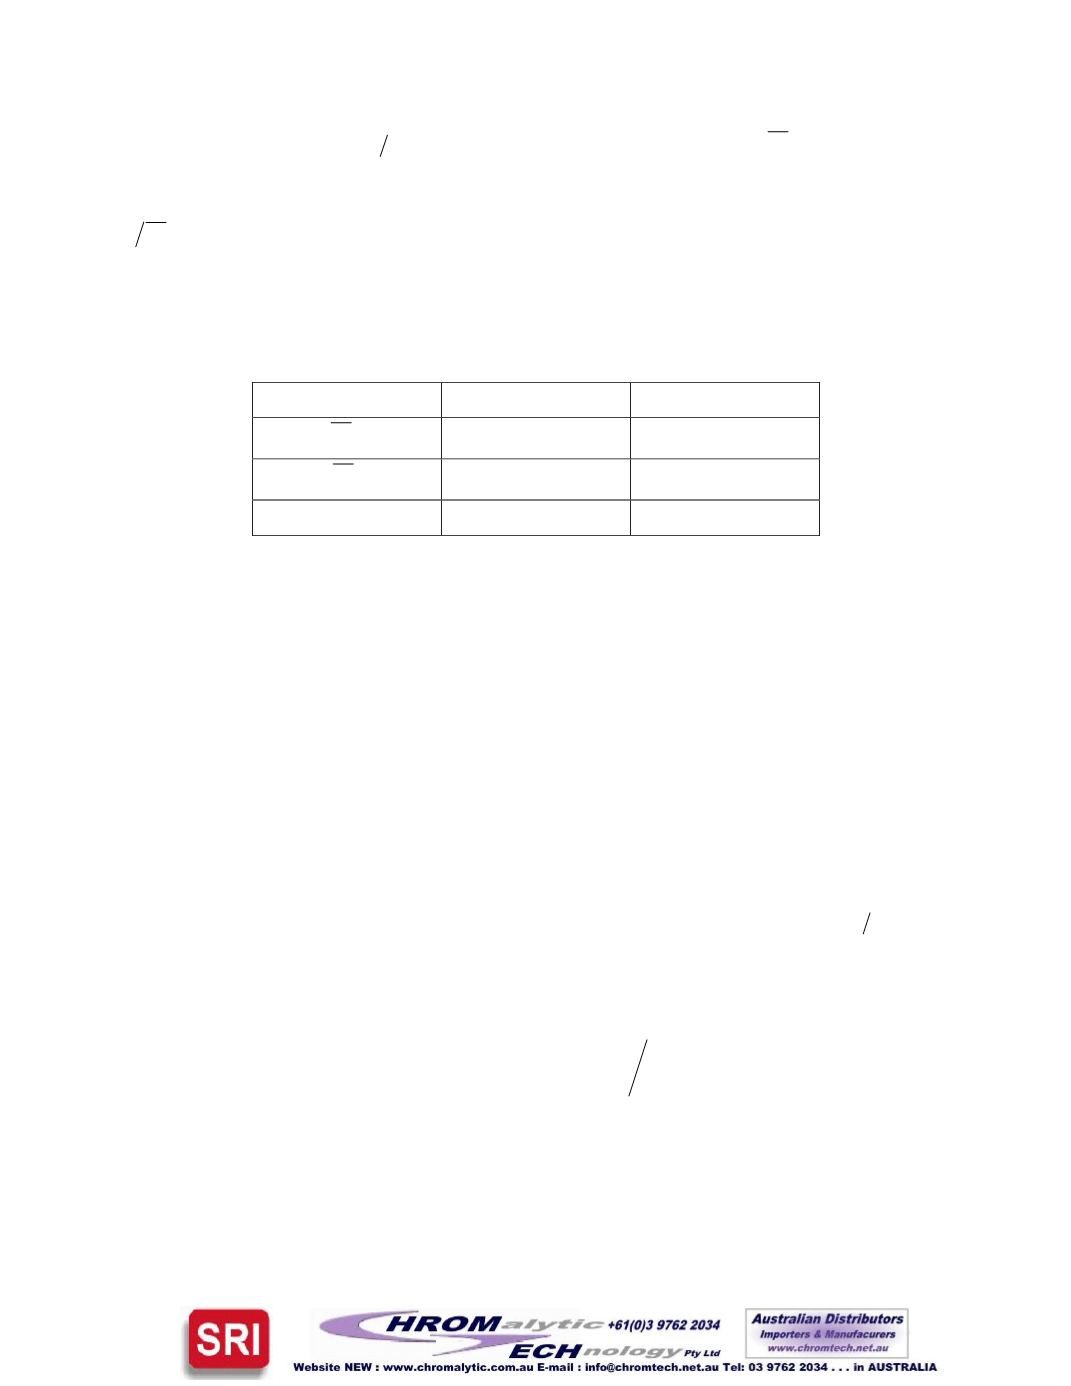
obtained and are summarized in the following table.
PolymerMolecularWeightAverages
P000604
P000606
w
M
143,000
299,000
n
M
69,500
99,300
PDI
2.06
3.01
ObtainingNormalizedMolecularWeightDistributions
Asmentioned the polydispersity index (PDI) is often used as ameasure of the breadth of the
molar mass distribution. However it is a often a poor substitute when compared to a graphical
representation of the complete molecular weight distribution curve, especially when comparing
polymer distributions. To a first approximation, the raw chromatogram (a graph of detector
response,
) (
e
t f
, versus elution time,
e
t
) is a graphical representation of the distribution.
However, the chromatogram height is injection concentration dependent, making comparisons
difficult, and
e
t
is often non-linearwith
)
ln(
M
, as evidenced by a third order calibration curve.
A normalized molecular weight distribution function is given by
)
ln( d d ) (
M w Mw
-=
.
Conversion of
) (
e
t f
versus
e
t
to a normalized molecular weight distribution plot (i.e.
) (
Mw
versus
M
or
)
ln(
M
), is obtained by considering that theweight fraction,
w
d
, of polymer which
elutes between
e
t
and
e
e
t
t
d
+
is given by:
ò
¥
=
0
d) (
d) (
d
e
e
e
e
t t f
t t f w
where the integral in the
denominator is simply the area under the chromatogram. Thus, an analytical approximation of
dw
at the
i
th
slice is
i
w
, theweight fraction of polymer


