Restek Corporation • (800) 356-1688 • (814) 353-1300 •
The FDAhas defined two approaches to testing food contact
materials: migration studies versus residual studies. Inmigra-
tion studies, food-simulating solvents are used tomodel the
amount ofmaterial that migrates into the product. This is per-
formed under worst-case, intended-use conditions. Changes in
the food or ingredients used, such as a change in the fat content,
can affect themigration of compounds out of the packaging
material. For this reason, it is important to test the packaging
under simulated use conditions to determine real-life effects on
the food product.
3
Residual studies estimate aworst-case dietary concentration
level, assuming 100%migration of any volatiles generated into
the food product. In residual studies, the level of each substance
ismeasured in the finished food-contact article. If nothing is
detected in the sample, then the validated detection limit can be
used to estimate the dietary concentration.
While there are specificmethods available formonitoring
volatile compounds in defined systems, method development
and validation often is the responsibility of the analyst.
American Society for Testing andMaterials (ASTM)Methods
4
F1308-98 and F1519-98 are qualitative and quantitative proce-
dures (respectively) formonitoring the volatiles generated by
microwave susceptor systems. Volatile extractables are defined
as substances released from the susceptor and detected in the
headspace. It is important to note that extractability does not
necessarilymeanmigration to the food.ASTMF1308-98 is a
quantitative procedure inwhich the packagingmaterials are
heated in a sealed systemwithin amicrowave prior to drawing
a headspace sample and injecting it into aGC/MS system.
ASTMF1519-98 is a qualitative procedure for identifying the
volatiles generated during simulated use conditions. This proce-
dure uses a purge and trap apparatus to collect and concentrate
the volatile compounds. Thesemethodswere used to develop
the general procedure for testing volatiles in food contact pack-
aging as described in this application note.
Experimental Conditions
To develop a general method formonitoring volatiles in food
contact packaging, we created a target list based on compounds
that have been detected in processed packagingmaterials. The
use of amass spectral detector will enable the identification of
other volatiles generated.We selected a low-bleed, Rtx
®
-5MS
capillary column to allow analysis of thewidest range of com-
pounds. Initial separation parameterswere entered into a com-
putermodeling program, which optimizes the separation based
on the column geometry, the oven temperature program, and the
linear velocity (Table I, on the back page).
An internal standard (IS) solution of 4-butanonewas prepared
by diluting 300mLof 4-heptanone to 1 liter with purifiedwater.
The final concentration of the IS solutionwas 245mg/mL. The
high standard solutionwasmade by adding 50mLof each com-
ponent to 475mLof the IS solution, and diluting to 500mL
using the IS solution.Medium and low standard solutionswere
prepared using 25mLand 10mLof each component, respective-
ly, and diluting each to 500mLusing the IS solution. The chro-
matogram of a 12-component high standard solution is shown
in Figure 1. Blank runswere performed before each standard
and sample by analyzing a 100mLaliquot of the IS solution.
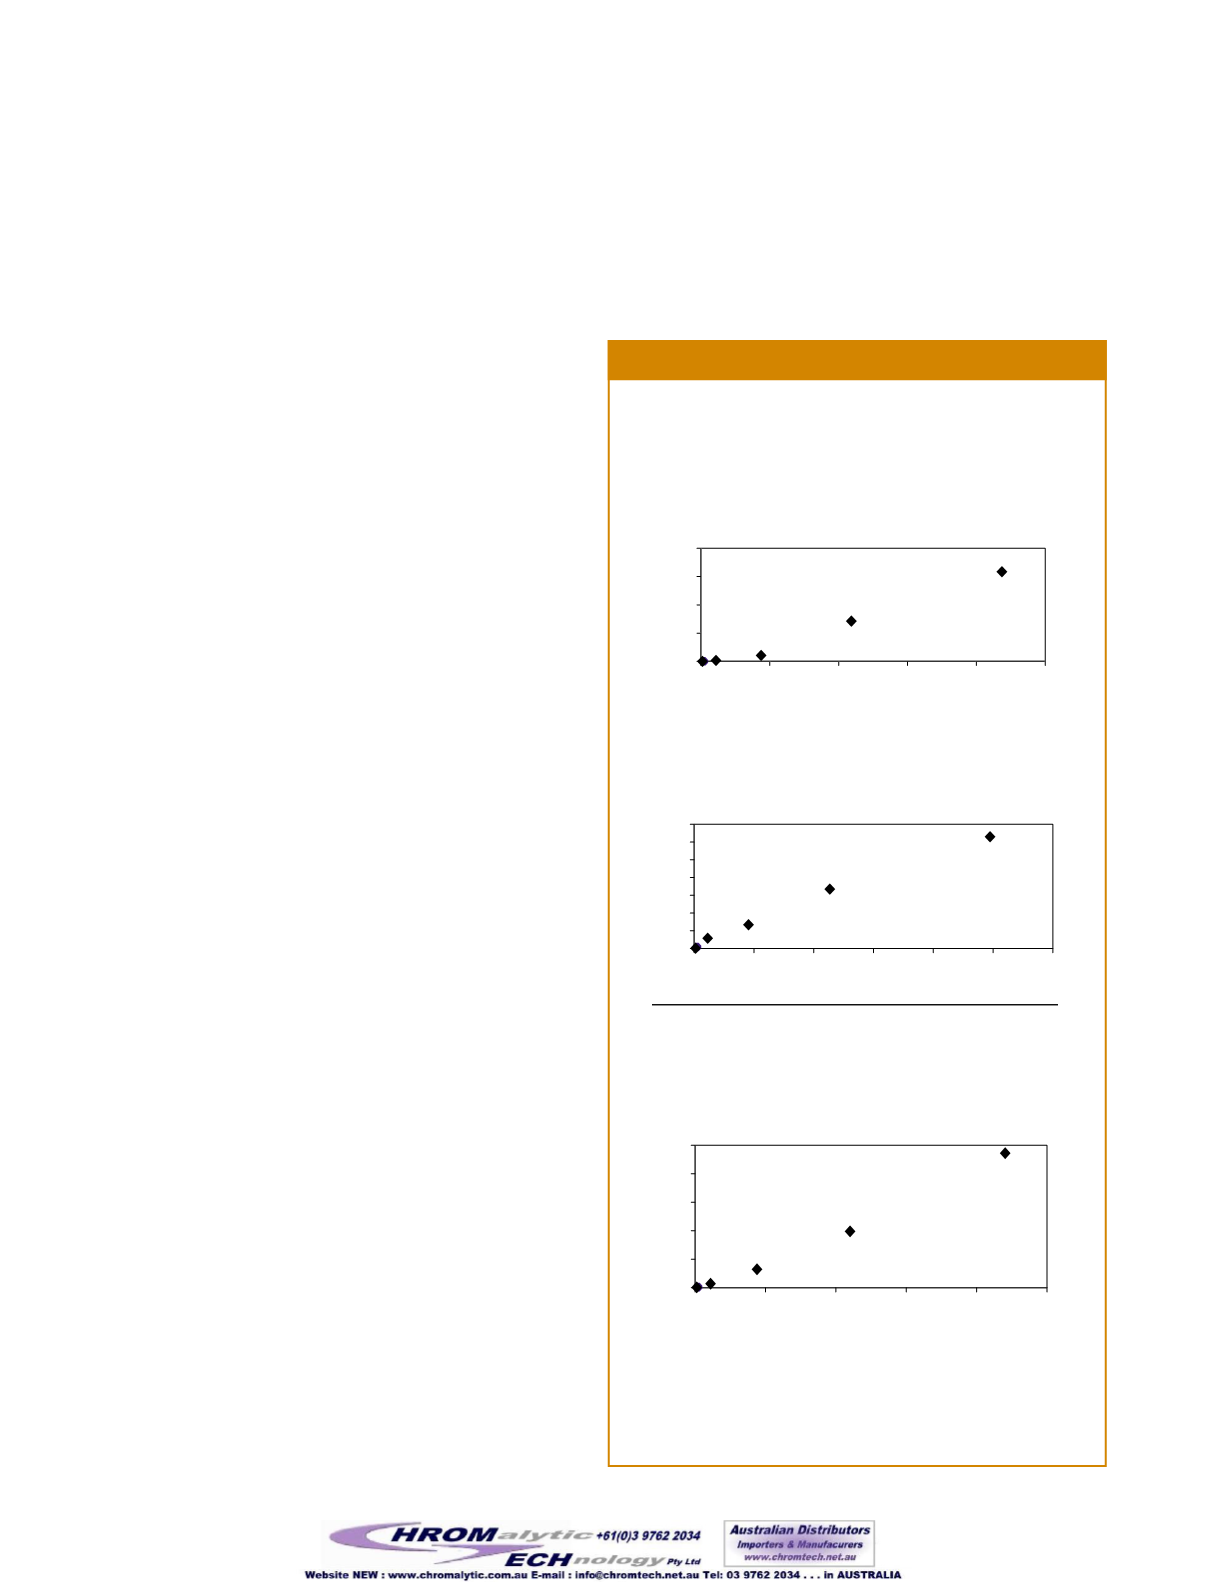
In order to determine the linearity of three packaging volatiles
using this procedure, a series of standard solutions containing
Figure 2
The Rtx
®
-5MS column exhibits good linearity for 3 volatile com-
pounds that may be present in food packaging.
Tested over an approximate concentration range of 0–10 µg/in
2
for each component. R
2
= 0.992 (THF), 0.985 (benzene),
and 0.994 (styrene).
THF, benzene, styrene, and 4-heptanone (IS) were prepared and
analyzed under the optimized parameters given inTable I. The
standard preparation procedure described above alsowas used
to prepare the linearity solutions. The approximate concentra-
tion range for each compoundwas 0-10µg/in
2
. The linearity
plots for three of the components are shown in Figure 2, with
the relative peak area (peak area for the volatile/peak area for
the IS) plotted vs. the concentration in µg/in
2
. To further increase
the sensitivity of this analysis, theMS can be operated in select-
ed ionmode.
THFLinearityPlot
0
1
2
3
4
5
0
2
4
6
8
10
Concentration, µg/in
2
BenzeneLinearityPlot
0
1
2
3
4
0
2
4
6
8
10
Concentration, µg/in
2
StyreneLinearityPlot
0
1
2
3
4
5
6
7
0
2
4
6
8
10
12
Concentration, µg/in
2
Relative PeakArea
Relative PeakArea
Relative PeakArea


