621
S
SPECTROPHOTOMETERS
The MRC Windows based PC application software UV/Vis Analyst takes the best features of the stand-alone
version plus more powerful data processing, expanded data collecting, and storage capability. It comes
standard with PC models and is optional to stand-alone models.
The PC application software offers:
●
Photometric Mode
●
Quantitative test (standard curve)
●
Wavelength
Scan
●
Kinetics
●
DNA/Protein
●
Multi-Wavelength
●
System Utility.
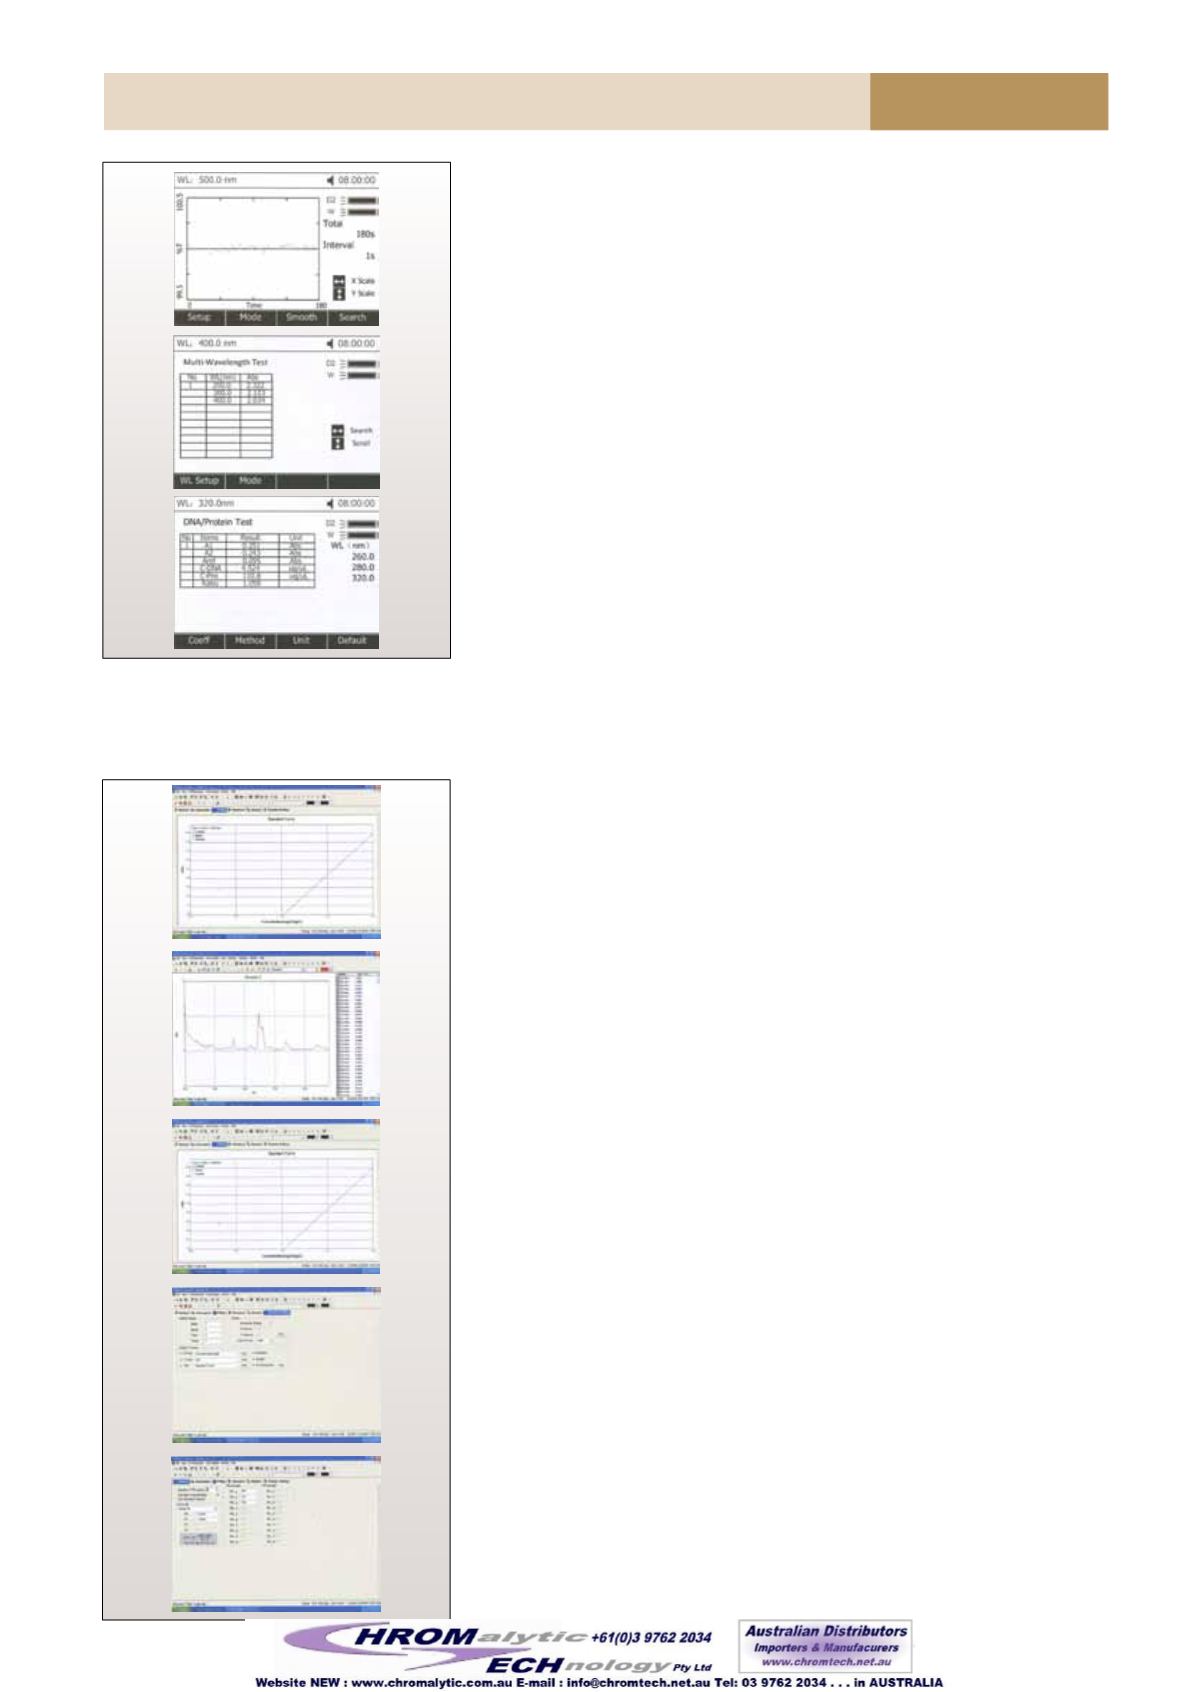
Quantitative Test (Standard curve)
Use up to 20 standards to establish standard curve.
Four methods for fitting a curve:
●
Linear fit
●
Linear through zero
●
Square fit
●
Cubic fit
Wavelength Scan
Automatically record peaks and valleys. The quantity of channels is
unlimited; you can simultaneously store as many as desired.
Post-run manipulation and processing includes:
●
Re-scaling axes, curve
●
1 st to 4th derivative
●
Smoothing, combination, zooming, overlap.
Kinetics (Abs vs. Time)
The Kinetics mode may be used for time course scanning or reaction
rate calculations. Abs. Vs. Time graphs are displayed on the screen in
real time. Waiting time, measurement time and time intervals may be
entered.
Post-run manipulation includes re-scaling, curve tracking and selection of
the part of the curve required for the rate calculation.
Rate is calculated using a linear regression algorithm before multiplying by
the entered factor.
DNA/Protein
Concentration and DNA purity are quickly and easily calculated:
Absorbance ratios 260nm/280nm with optional subtracted absorbance at
320nm.
DNA Concentration=62.9*A260-36.0*A280
Protein Concentration=1552*A260-757.3*A280
Other wavelengths and factors may be entered.
Multi-wavelength
Up to 20 wavelengths can be selected and multiple samples can be
measured. (Auto cell changer is required to run multiple samples
automatically)
UV/Vis Analyst for SPECTRO-UV3 & SPECTRO-UV6 Series
Multi-Wavelength
Up to 10 wavelengths may be entered, allowing the measurement of
multiple wavelengths on a Series of Samples.
DNA/Protein Test
Concentration and DNA purity are calculated absorbance ratios
260nm/280nm or 260nm/230nm with optional subtracted absorbance at
320nm
DNA Concentration=62.9*A260-36.0*A2BO Or 49.1*A260-3.48*A230
Protein Concentration=1552*A26o-757.3*A2Bo Or 183*A260-7S.8*A230
Other wavelengths and factors may be entered.
Kinetics
This mode may be used for time course scanning or reaction rate
calculations. Abs. vs. time graphs is displayed on the screen in real time. Wait
time and measurement time up to 12 hours may be entered with time
intervals of 0.5, 1, 2,5, 10, 30, seconds and 1 min. Post-run manipulation
includes re-scaling, curve tracking and selection of the part of the curve
required for the rate calculation. Rate is calculated using a linear regression
algorithm before multiplying by the entered factor.
VIS - UV Scanning Double Beam


