Medical CannabisPotencyTesting
using theSRI 8610CFIDGC
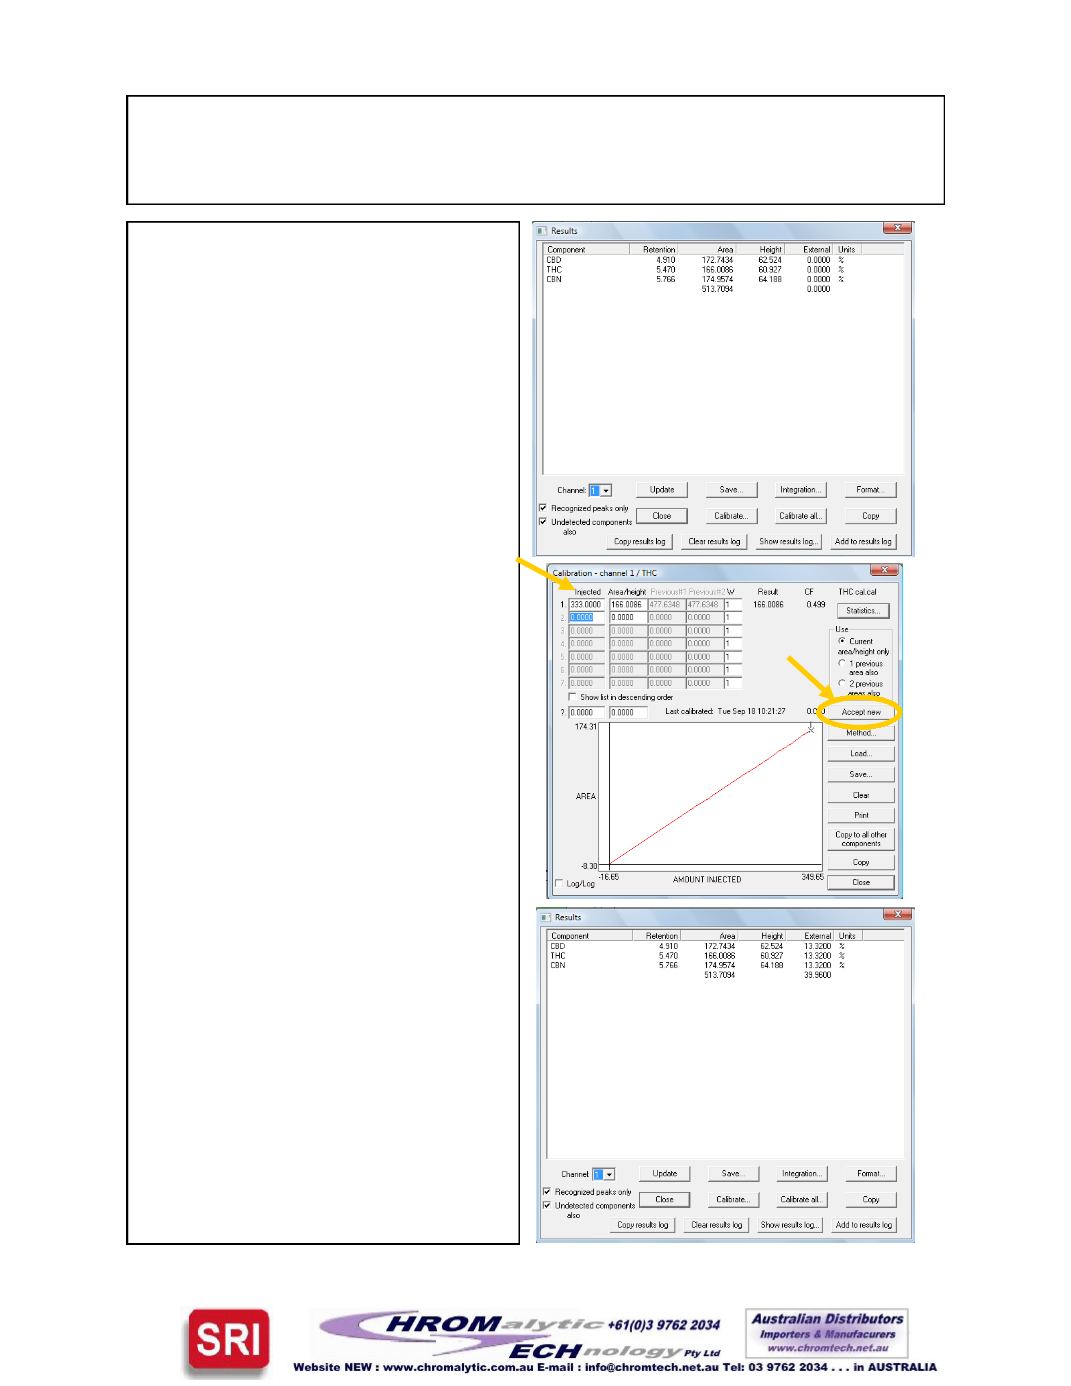
Check theResults screen. If you in-
jectedaprimary standard the area
counts for the cannabinoids should
bebetween420 and540and roughly
equal to eachother (+/- 30). If you
injected theworking standard the
area counts shouldbebetween140
and 180 and roughly equal (+/- 10).
Calibrate eachpeak by creating a
calibration curve. See thePeak-
Simple tutorial describing this
process. In the calibration curveenter
the amount of standard you just in-
jected. Thiswill be 333 (for 333ng/ul)
or 1000 (for 1000ng/ul). Type this
number in the top left cell of the
spreadsheet in the calibration curve.
Then click theAccept Newbutton to
transfer the peak’s area into the top
row 2nd column. Save the curve un-
der some name. Do this for all the
peaks.
Navigate to theView/Results screen
to see the report.With the integration
screenand components setup as dis-
cussed earlier in thedocument the
percent concentrations of CBD, THC,
andCBNwill eachbe displayed as
13.32% (or 40% if primary standards
were injected). You are now cali-
brated and ready to inject real canna-
bis samples.
Page10


