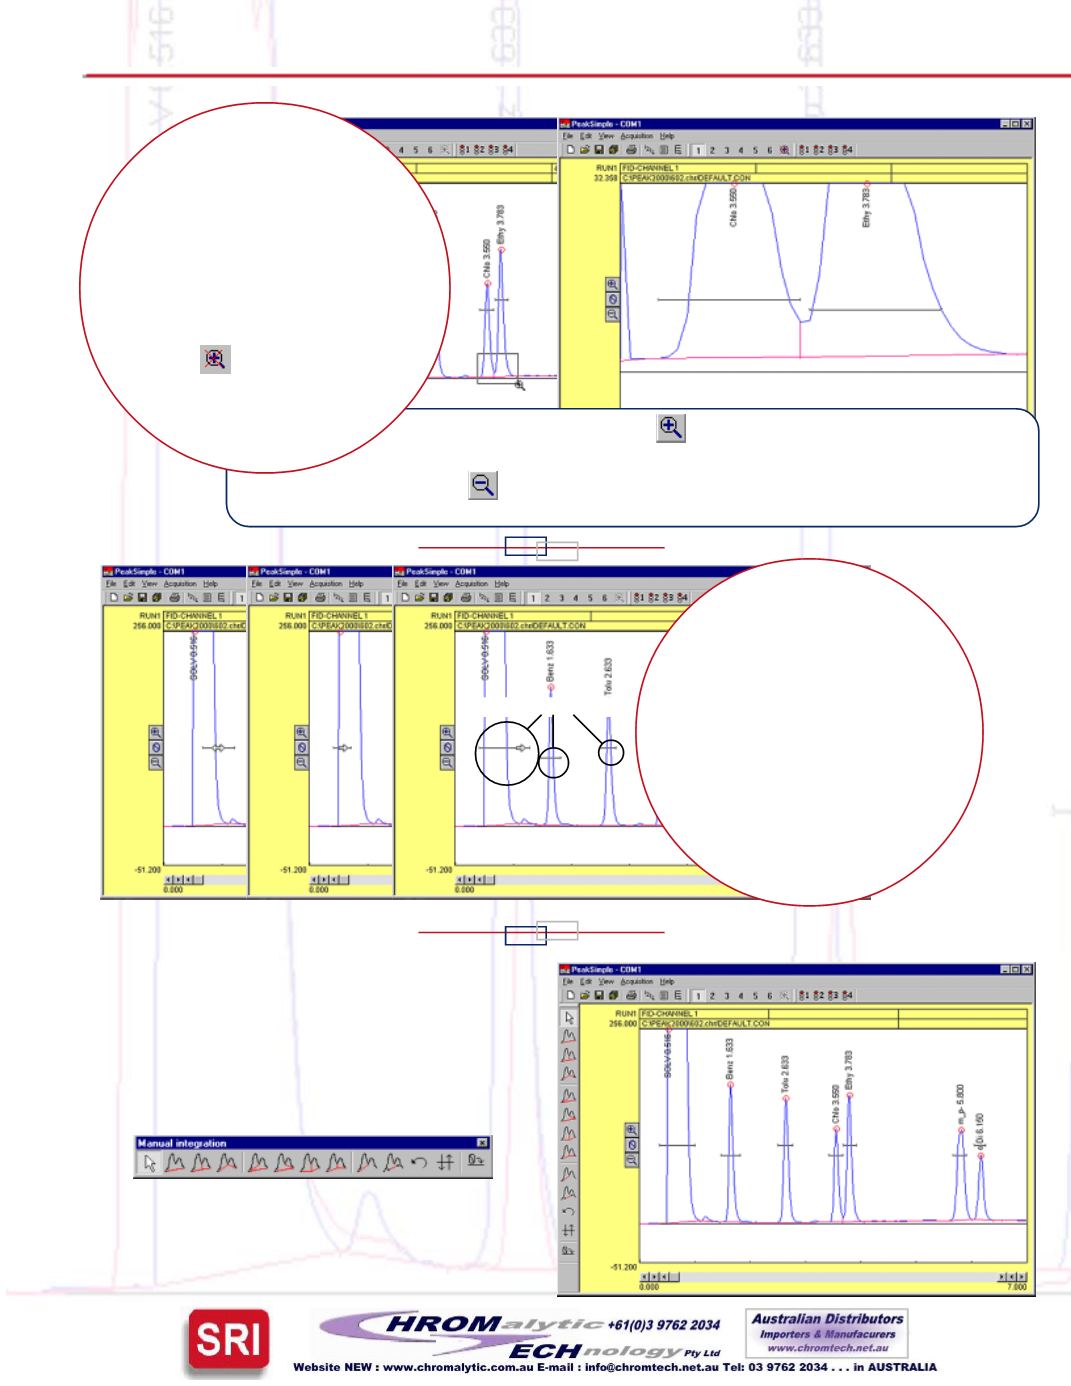
A mouse click on one icon
vertically enlarges the peaks in the
chromatogram, decreasing the y-axis display limits by a factor of two. A click
on another icon
increases the y-axis display limits by a factor of two, which
vertically shrinks the chromatogram peaks.
PeakSimple gives
you two ways to closely
examine
data
in
the
chromatogram window. Click and
drag the mouse cursor to draw a
rectangle around the area you wish to
enlarge, and that areawill expand to fill
the chromatogram window. This may
bedonemultiple times. Clickingon the
Unzoom
icon in the toolbar
unzooms one level at a time
until you return to the
original resolution.
MOVE
SHRINK
STRETCH
CLICK&DRAG
RETENTION WINDOWS
Retention window brackets are
visible onscreen, and may be
grabbed, dragged onto a peak,
widened, or narrowed. The
component table is automatically
updated when a retention
window is graphically
movedormodified.
TheManual Integration toolboxmaybeplacedabove
(asshownat right)or to the leftof thechromatogram
window. It may also be dragged “off” the
chromatogramwindow to float as an independent,
move-ablewindow.
Manual integration tools permit you to refine the
integrationmethodapplied toanypeak. Themanual
integration toolbox is available at a click of the
mouse. Baseline projection may be “rubber-
banded” from point to point, forced to a valley,
dropped vertically, skimmed, etc.
MANUAL INTEGRATION
Retentionwindows
TAKEACLOSER LOOKATYOURDATA
Zoomedarea
selection
PeakSimple for Windows
TM
Software


