6
During the measurement, the
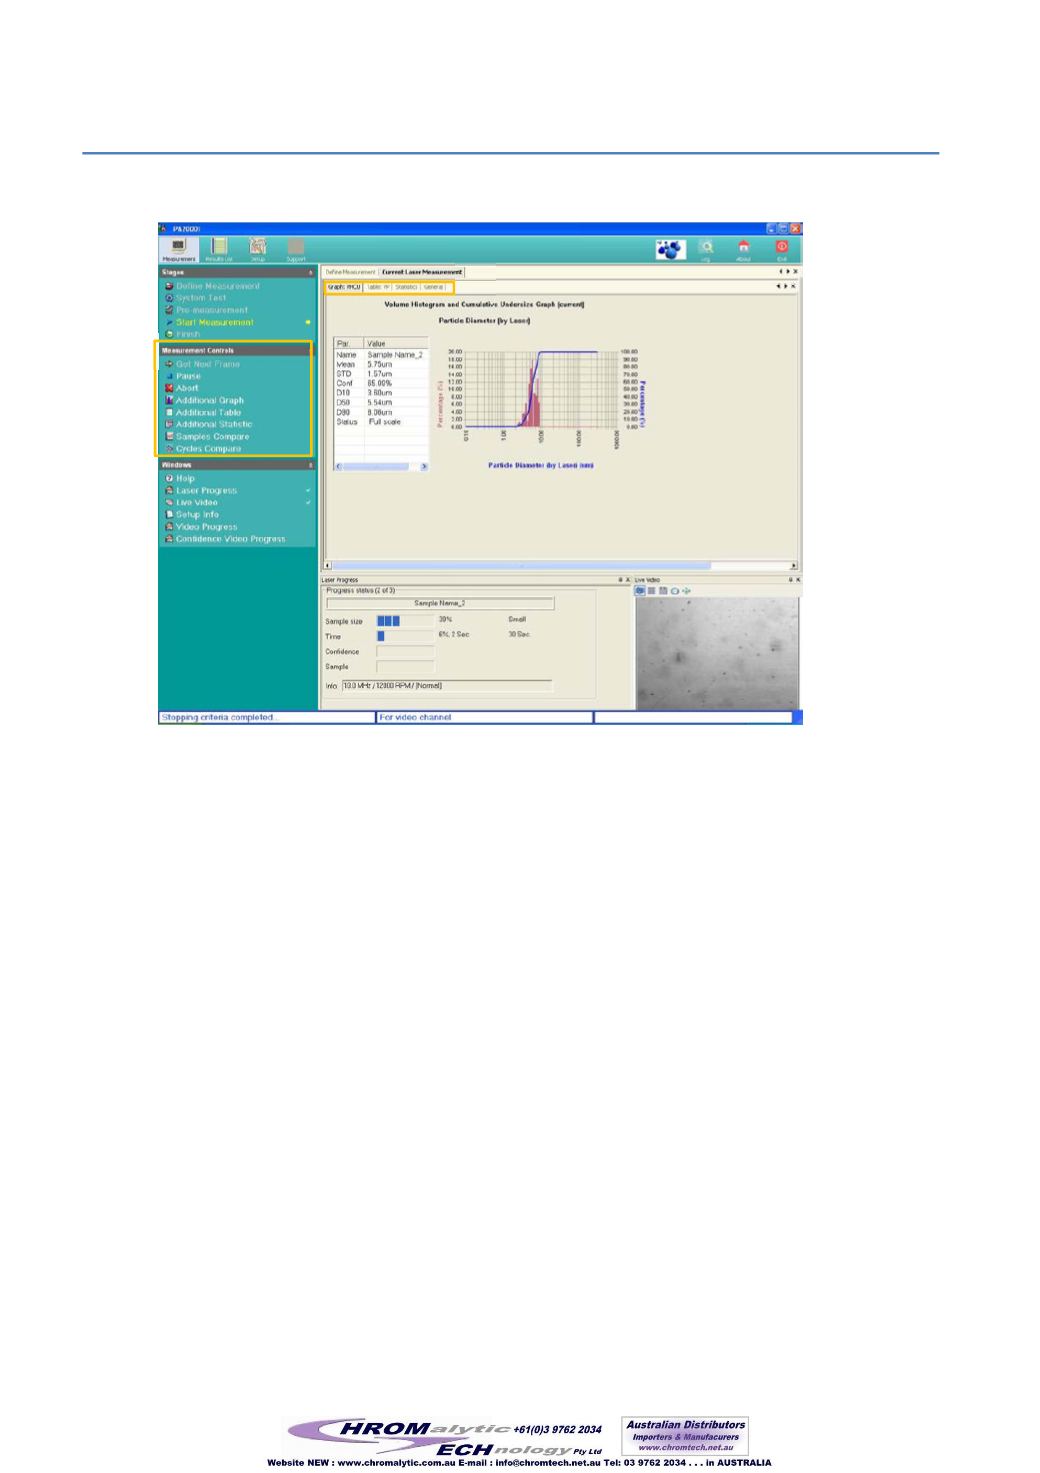
Current Laser Measurement
window appears:
•
In the main window, the statistics of the recorded data are displayed in real-time by
graphs and tables. The tabs bar above (1) enables to switch between different
display modes defined according to the setup.
•
The 'Measurement controls' bar (2) enables to
Pause
or
Abort
the measurement.
Additional graphs, tables and statistic
with more parameters can be added to the
display (added to the tabs bar). The real-time measured data can be compared with
previously measured data. For comparison with samples in the results list press
Samples compare
and for comparison with previous cycles in the same
measurement press
cycles compare
.
1
2
267


