


 95 / 413

Simplify PAH Analysis
with Restek Columns
and Standards!
Results in Table I demonstrate that good recoveries were obtained under these preliminary con-
ditions, especially considering that hydrophobic compounds were being extracted in hydrophilic
QuEChERS solvent. High recoveries were noted for some compounds (e.g. fluoranthene), but
were not due to isobaric interference as evidenced by high efficiency separation of PAHs from
matrix (Figure 2) and by good agreement between sample and reference spectra (Figure 3).
Conclusion
Combining QuEChERS extraction with GCxGC-TOFMS, using Rxi®-17Sil MS and Rxi®-1ms
columns shows great promise for analyzing PAHs in seafood. Labs interested in alternatives to
the NOAA method should consider procedures based on this approach.
Visit our technical blog at
www.restek.com/adv011for more details.
Table I
Preliminary conditions gave
good recoveries for most PAHs (n = 3).
Average
Q NIST µg/kg by
PAH
Mass µg/kg GCxGC RSD%
Naphthalene-D8
136 ISTD ISTD ISTD
Naphthalene
128 9.68 63
5
2-Methylnaphthalene
142 8.1 8.6 15
1-Methylnaphthalene
142 5.8 5.4 8
Biphenyl
154 NA 4.2 1
2,6-Dimethylnaphthalene 156 NA 9.1 3
Acenaphthylene
152 NA 1.7 18
Acenaphthene-D10
162 ISTD ISTD ISTD
Acenaphthene
154 NA 3.3 22
2,3,5-Trimethylnaphthalene 170 NA 4.0 13
Fluorene
166 NA 8.8 8
Phenanthrene-D10
188 ISTD ISTD ISTD
Phenanthrene
178 74.4 113 5
Anthracene
178 2.46 8.1 8
1-Methylphenanthrene 192 17.6 29 12
Fluoranthene
202 287 376 5
Pyrene
202 186 229 4
Benzo(a)anthracene
228 31.1 39
9
Chrysene-D12
240 ISTD ISTD ISTD
Chrysene
228 123.6 199 5
Benzo(b)fluoranthene 252 41.5 53
0
Benzo(k)fluoranthene
252 18.95 22 12
Benzo(j)fluoranthene
252 21.4 18
3
Benzo(a)pyrene
252 9.73 12
5
Perylene-D12
264 ISTD ISTD ISTD
Perylene
252 6.80 5.0 3
Indeno(1,2,3-cd)pyrene 276 14.9 13
1
Benzo(ghi)perylene
276 23.7 20 10
ISTD = internal standard
NA = not analyzed by NIST
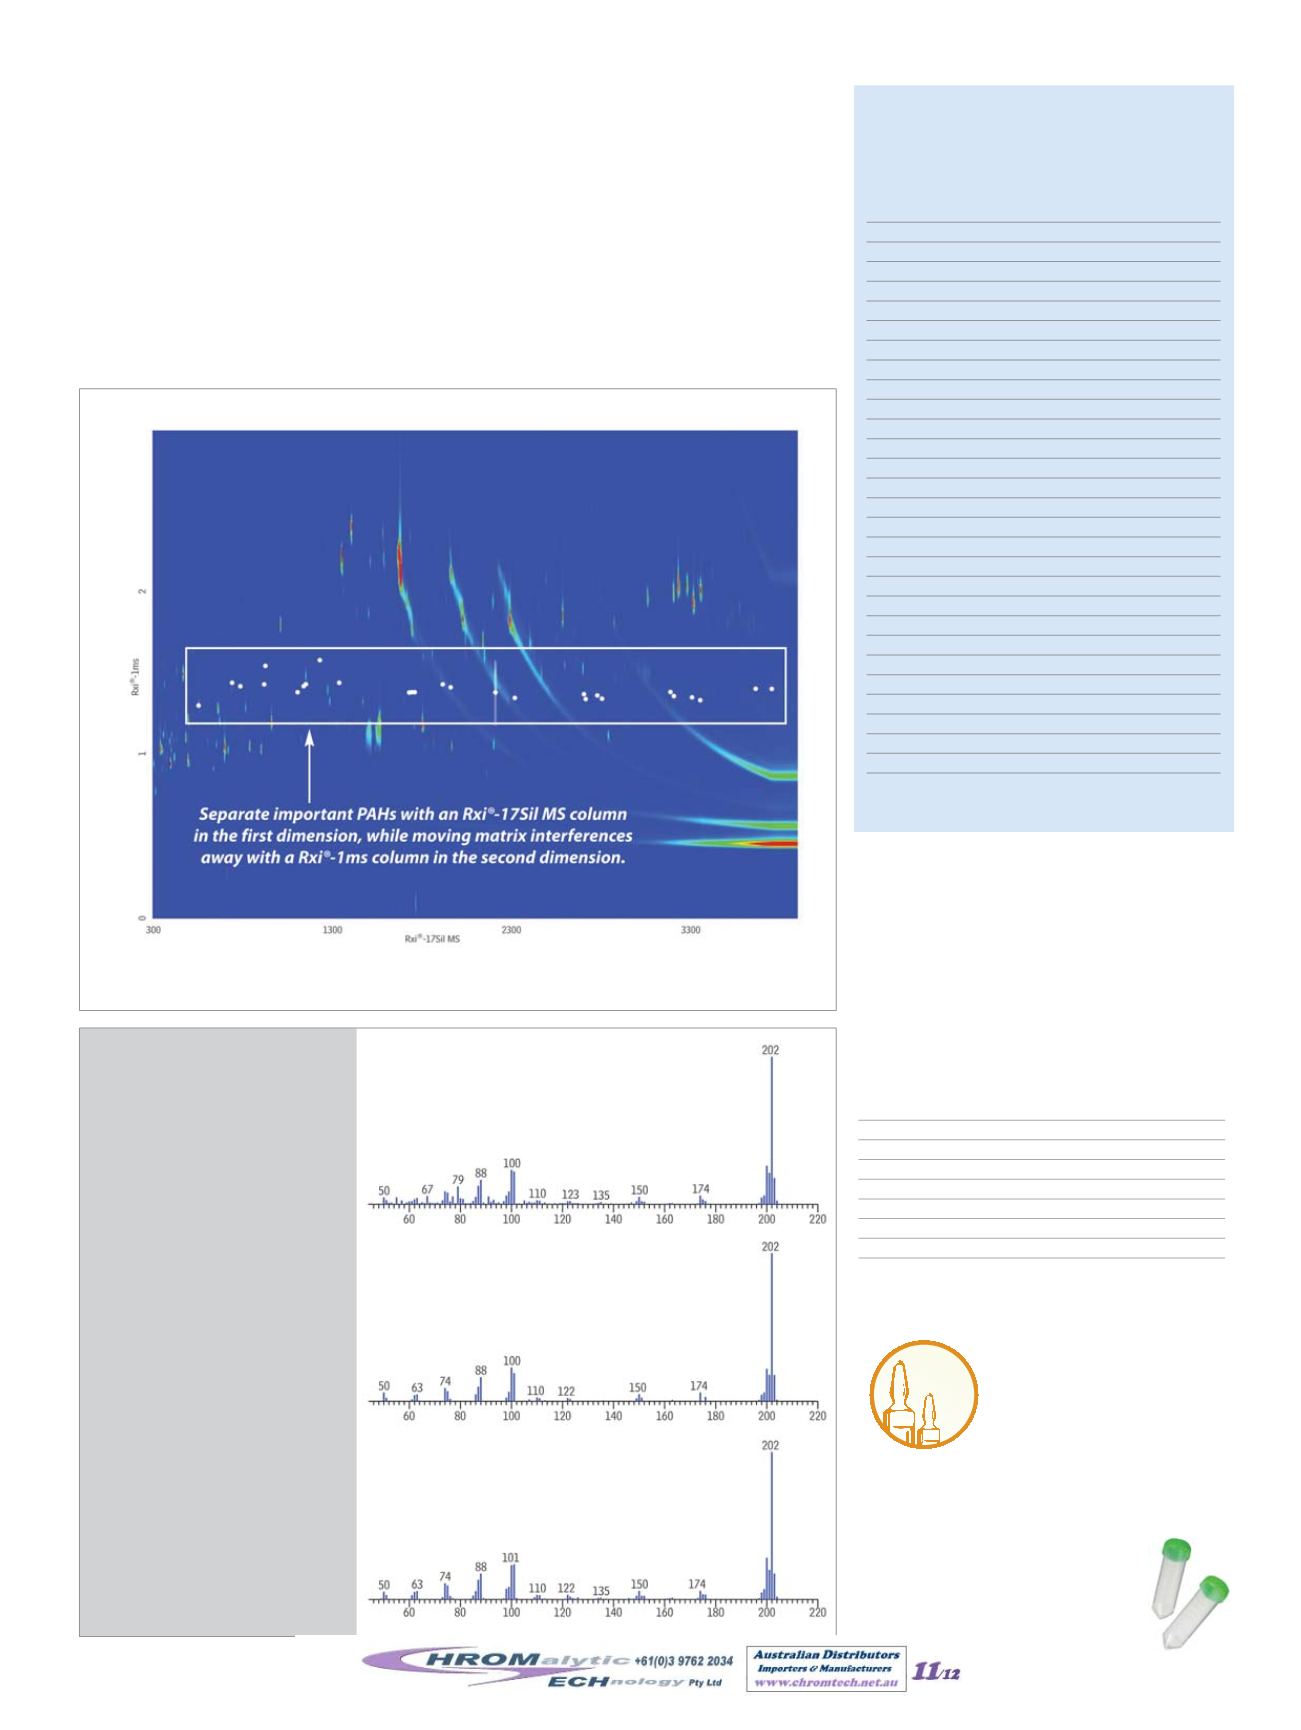
Figure 2
GCxGC-TOFMS contour plot of PAHs in mussels (QuEChERS extraction).
*Maximum temperatures listed are for 15- and 30-meter
lengths. Longer lengths may have a slightly reduced
maximum temperature.
ID
df (µm) length qty.
cat. #
0.18mm 0.18µm 20m ea.
14102
0.18mm 0.36µm 20m ea.
14111
0.25mm 0.25µm 15m ea.
14120
0.25mm 0.25µm 30m ea.
14123
0.25mm 0.25µm 60m ea.
14126
0.32mm 0.25µm 15m ea.
14121
0.32mm 0.25µm 30m ea.
14124
Rxi®-17Sil MS Columns
(fused silica)
(midpolarity Crossbond® silarylene phase;
equivalent to 50% phenyl methyl polysiloxane)
temp. limits: 40 to 340/360°C
Column: Rxi
®
-17Sil MS 30 m, 0.25 mm ID, 0.25 µm (cat.# 14123); Rxi
®
-1ms 1.2 m, 0.15 mm ID, 0.15 µm (cat.# custom);
Sample: NIST SRM 2974a freeze-dried; mussel tissue with incurred residues; Diluent: Acetonitrile.
For complete conditions visit
www.restek.comand search for GC_FF1197.
Figure 3
Good agreement
between sample and reference
spectra show target PAHs were
separated from isobaric
interferences.
Column:
Rxi
®
-17Sil MS 30 m, 0.25 mm ID, 0.25 µm
(cat.# 14123);
Rxi
®
-1ms 1.2 m, 0.15 mm ID, 0.15 µm
(cat.# custom);
Sample: NIST SRM 2974a freeze-dried
mussel tissue with incurred residues;
Diluent: Acetonitrile.
For complete conditions visit
www.restek.comand search for GC_FF1198.
PAH lists vary among
methods and labs.
Visit
www.restek.comfor a complete list of
stock products, or to
order a custom mix.
PAH
www.restek.com5
sec.
A. Caliper spectrum
B. Deconvoluted spectrum
C. Reference spectrum
For
Q-sep™ QuEChERS
product
information, see page 7 or visit
www.restek.com/quechersWebsite :
www.chromtech.net.auE-mail :
info@chromtech.net.auTelNo : 03 9762 2034 . . . in AUSTRALIA