


 163 / 628

 www.restek.com
161
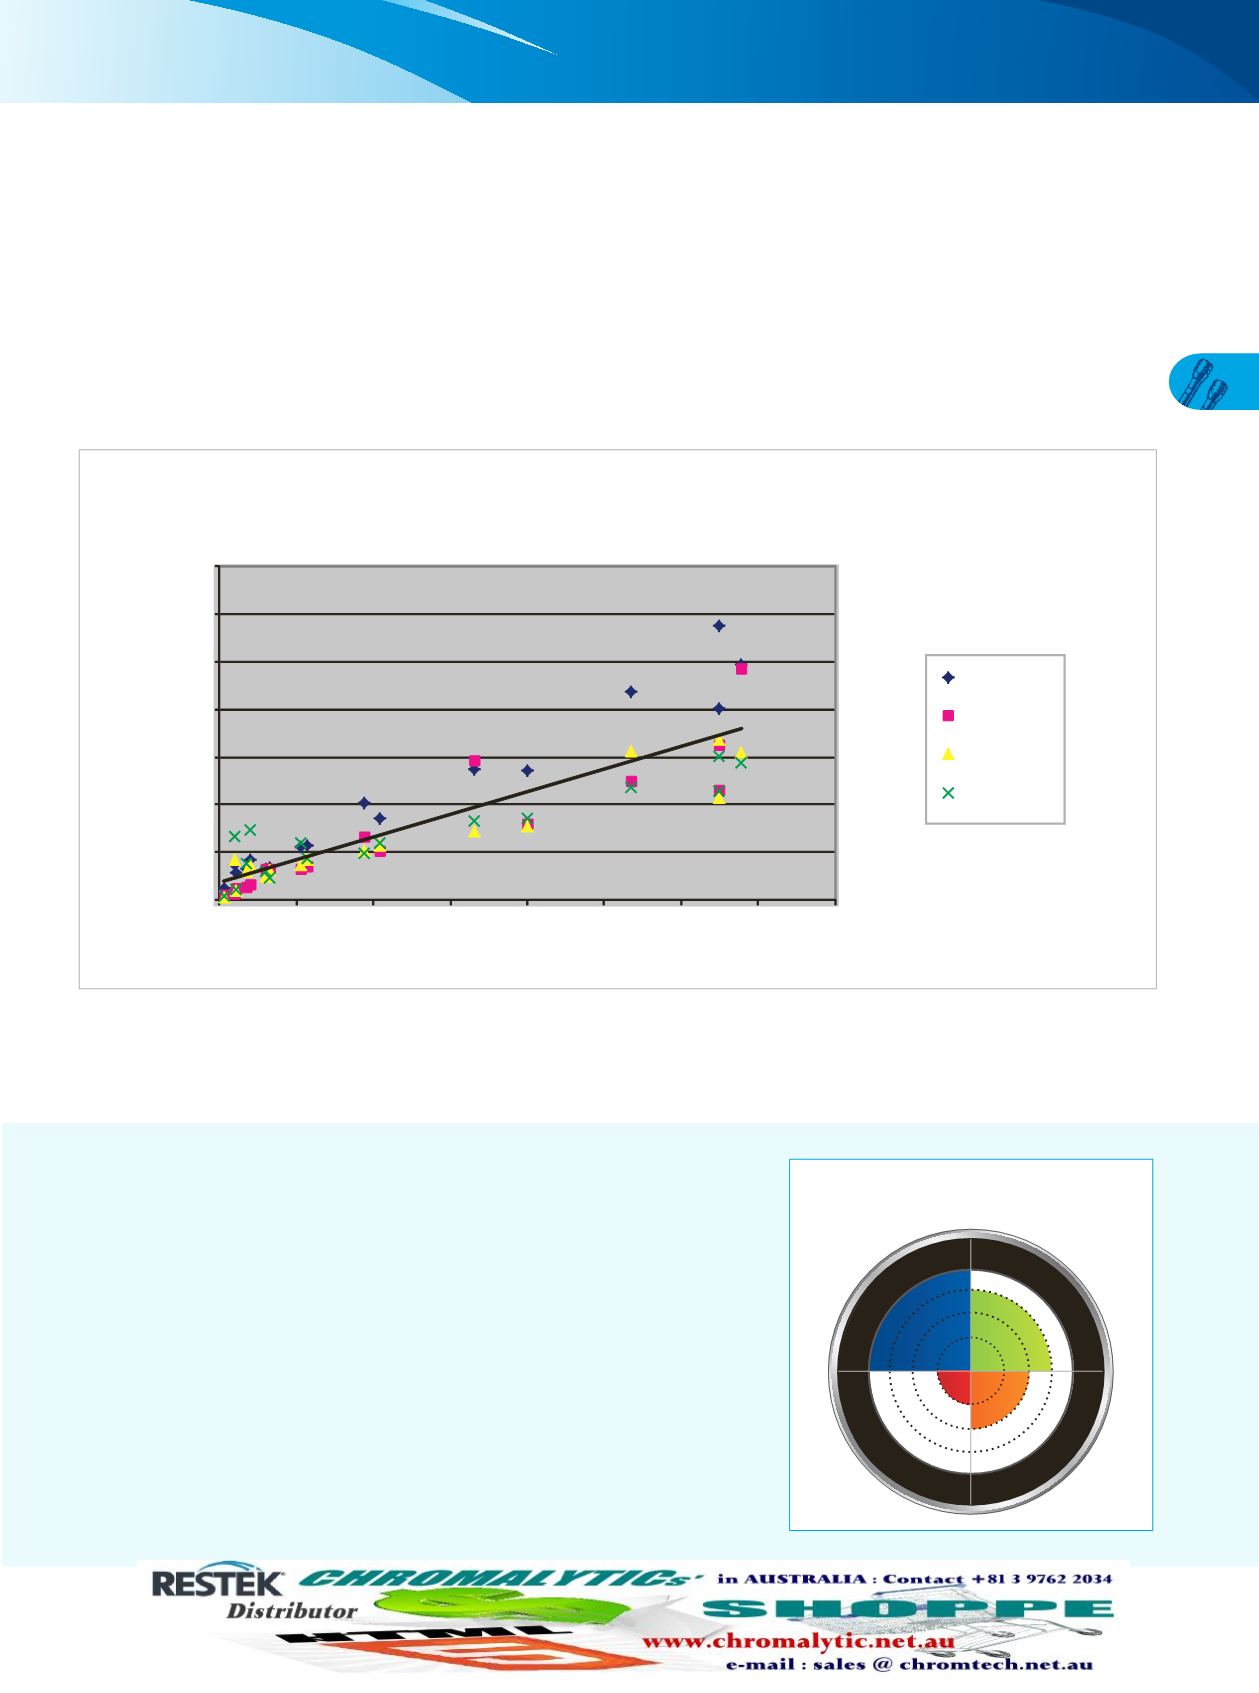
Figure 2:
Restek has extended the selectivity range for commercially available columns and defined a column
set—the four USLC® phases—that is ideal for fast column choice and faster method development.
LC COLUMNS
USLC® Columns
Evaluating and Extending Selectivity
The Restek® USLC® column set offers the highest range of alternate selectivity available.
The diverse selectivity provided by USLC® columns can be demonstrated empirically using the hydrophobic-subtraction model [1].
This model is a novel procedure for characterizing selectivity that uses test probes to define the solute and stationary phase interac-
tions in reversed-phase separations. Restek is leading the commercial application of this model by implementing it in the develop-
ment of USLC® bonded phases. To evaluate phase selectivity using the hydrophobic-subtraction model, the retention characteristics
of the solute probes are compared across different phases relative to a C18 benchmark with all columns using the same silica base.
The resulting scatter plot is an excellent way to visualize selectivity. Stationary phases with similar selectivity show high linearity
when graphed. However, stationary phases with alternate selectivity—even orthogonality—produce significant scatter around the
regression line. The high degree of scatter shown in Figure 2 shows just how diverse the phases in the USLC® column set are. When
we quantify column selectivity based on this correlation by calculating the selectivity (S) statistic [2], the resulting value of 46.7
shows that the USLC® column set truly has the highest range of selectivity available.
All columns were tested using
the same silica support.
Orthogonal phases
14.00
12.00
10.00
8.00
6.00
4.00
2.00
k Orthogonal phase
0.00
0.00
2.00
4.00
6.00
8.00
10.00
12.00
14.00
16.00
k C18 phase
y = 0.4755x + 0.7619
R
2
= 0.7819
S = 46.7
Aqueous C18
IBD
Biphenyl
PFPP
USLC® Column Interaction Profile
Put simply, selectivity is the retention of one compound relative to
another. Therefore, because solutes will be retained to different degrees
by different molecular interactions, we can fundamentally define a
column’s selectivity based on the molecular interactions it delivers.
Each USLC® column is optimized for a different chemical interaction.
The pie chart provided for each USLC® stationary phase in this catalog
(Figure 3) identifies the same four molecular interactions (color coded
to correspond to the retention of a different solute type). The more
rings shown for a given interaction, the more significant a role it plays in
defining solute retention.
If you know what type of column interaction you need for your analysis,
use these charts to select your USLC® column.
Figure 3:
A look at a sample USLC®
column interaction profile.
Aqueous C18
IBD
D
i
s
p
e
r
s
i
o
n
H
-
B
o
n
d
i
n
g
P
o
l
a
r
i
z
a
b
i
l
i
t
y
C
a
t
i
o
n
E
x
c
h
a
n
g
e
D
i
s
p
e
r
s
i
o
n
H - B o n di
n
g
References
[1] L.R. Snyder, J.W. Dolan, P.W. Carr,
The Hydrophobic-Subtraction Model of Reversed-Phase Column Selectivity
, J. Chromatogr. A 1060 (2004) 77.
[2] U.D. Neue, J.E. O’Gara, A. Mendez,
Selectivity in Reversed-Phase Separations Influence of the Stationary Phase
, J. Chromatogr. A 1127 (2006) 161.