
7/8
©Copyright 2012 LDetek inc. • 271, Saint-Alphonse Sud, Thetford Mines (Quebec) Canada G6G 3V7
LINEARITY AND ACCURACY
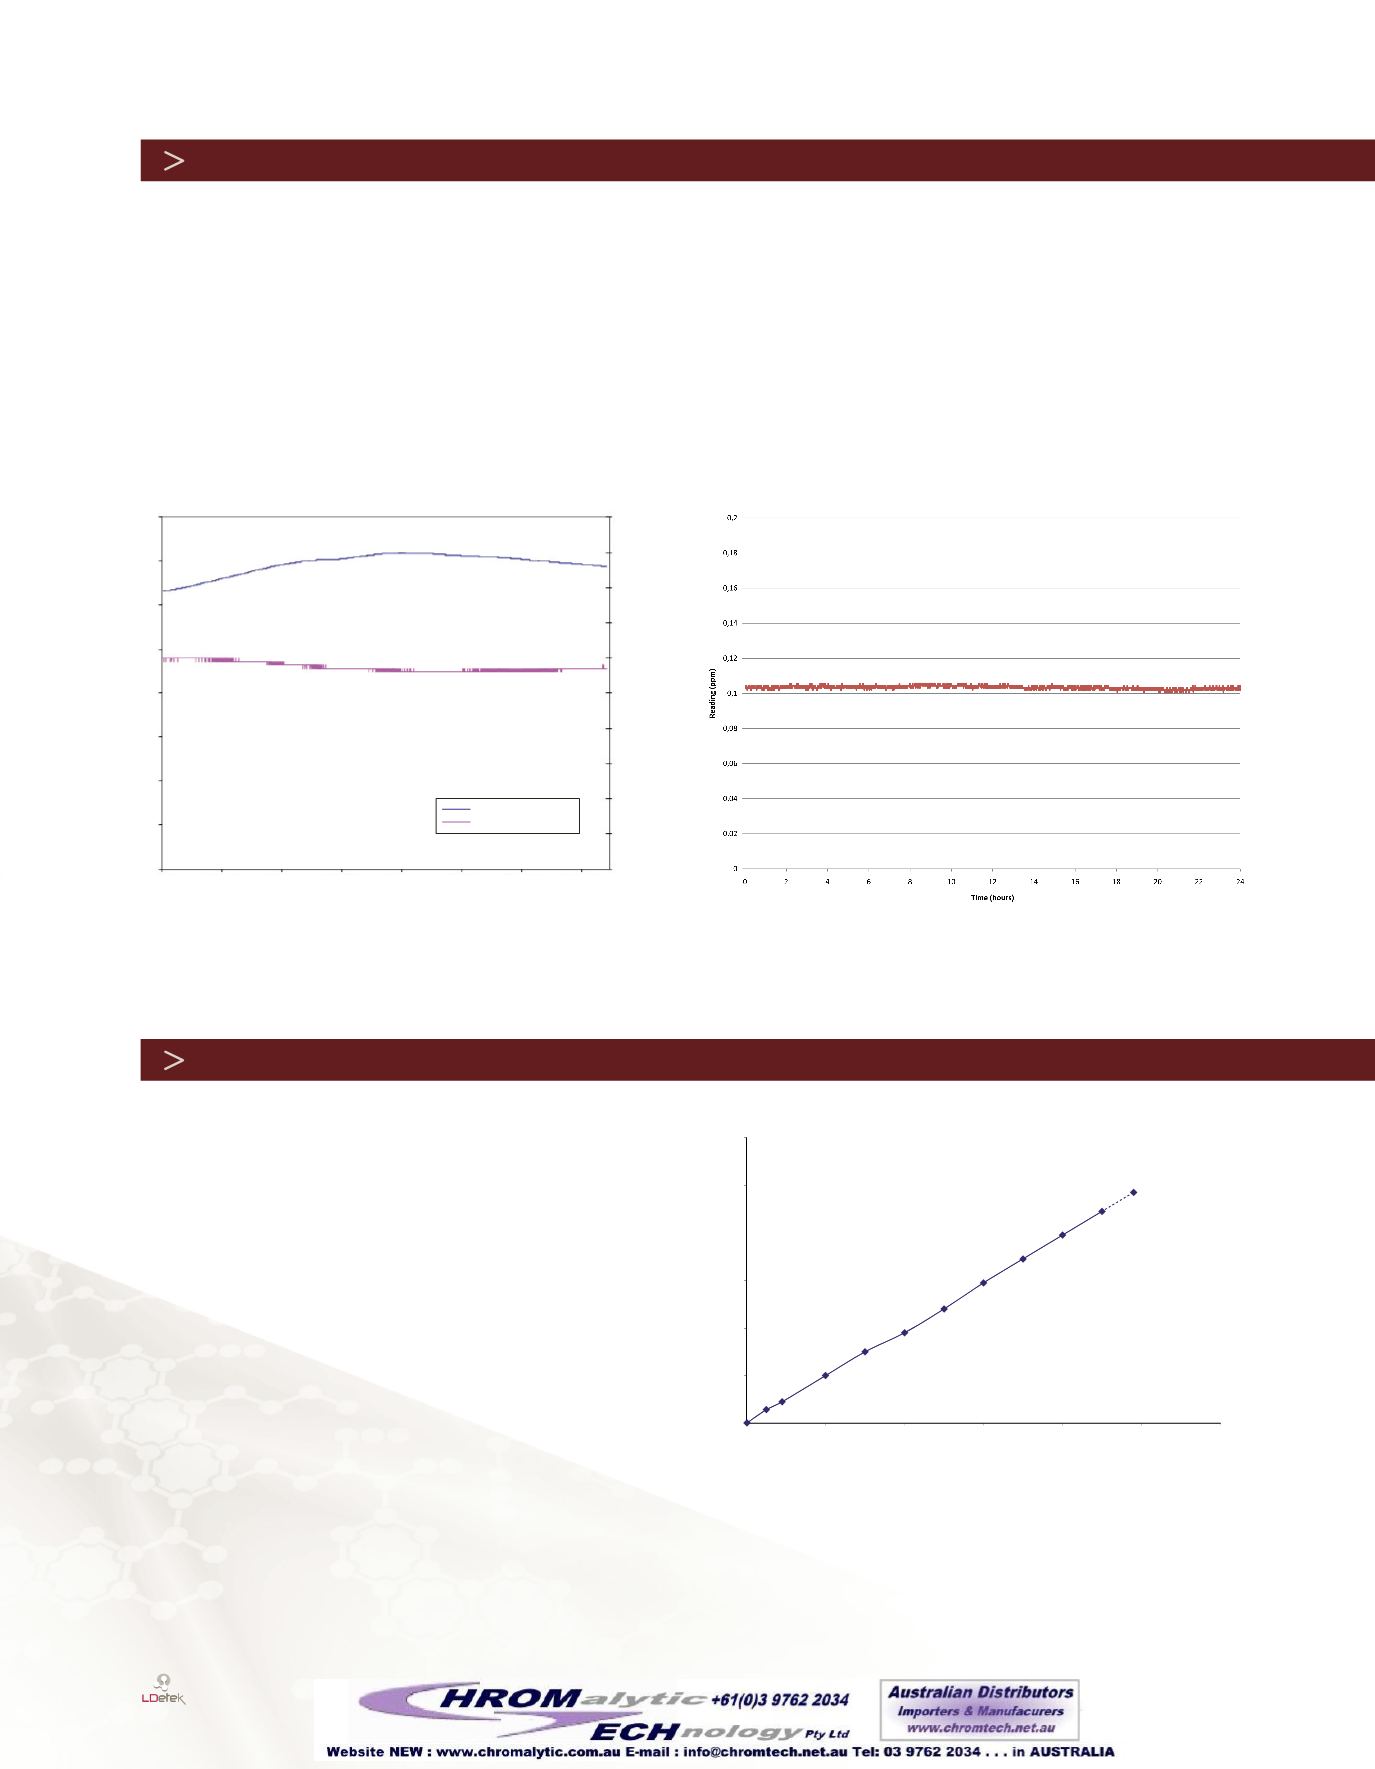
Stability of the analyzer has been evaluated through a few hours period. Temperature variation has been caused to show the stability
of the reading even with an unstable temperature environment. Those variations have been done on the analyzer itself and not on the
whole system installation which can be different from site to site.
With a deviation of 4.4 Celsius (31.6 to 36 degrees) on a 36 hours period, the reading has moved down from 300 ppb to 280 ppb.
This slight variation gives a 4.5 ppb / Celsius change. Considering that most of the installations are temperature controlled, no
temperature effect will be observed. Moreover, the resolution of the analyzer is 10 ppb and slight temperature variation will not
been seen by the software reading.
Stability has been evaluated on a 24 hours basis with stable environment (figure 13). The drift observed is less than 2 ppb.
Special care has been made on the linearity of the system.
Knowing that existing instruments on the market do not offer
linearity on the complete range of 0-100 ppm, LDetek has
improved its detection system to be sure that working and
calibrating the instrument on the range 0-100 ppm will offer
the best performance.
Figure 12
:
*Signal versus temperature
Figure 13
:
*24 hours stability on stable environment
10:04:48 14:52:48 19:40:48 00:28:48
Time
Temp. (Celcius)
40
35
30
25
20
15
10
5
0
0,5
0,45
0,4
0,35
0,3
0,25
0,2
Temperature (Celsius)
Reading (ppm)
0,15
0,1
0,05
0
Reading (ppm)
05:16:48 10:04:48 14:52:48 19:40:48
On figures 14, calibration of the instrument has been done
with a zero gas going through the LDP1000 gas purifier and
the same dilution system for the different concentrations
measured.
We have also made step changes in low concentration to
show the accuracy of the instrument. Figure 15 demonstrates
that a 10 ppb step change is easily detectable by the
LD8000. Measuring pure gas on the range 0-1 ppm is more
and more popular and such performance is appreciated from
gas producers.
Figure 14
: *
LD8000 linearity on 0-100 ppm range
Note:
This result has been obtained in LDetek facilities with the LDGSS stream selector device with a well purged system according to LDetek standard methods.
*
60,00
80,00
100,00
120,00
LD8000 ppm reading
0,00
0,00
20,00
40,00
60,00
80,00
100,00
120,00
20,00
40,00
Real ppm values
STABILITY


