FormNo. 203-821-258 02/05-REV0
LECO is a registered trademark of LECO Corporation
3
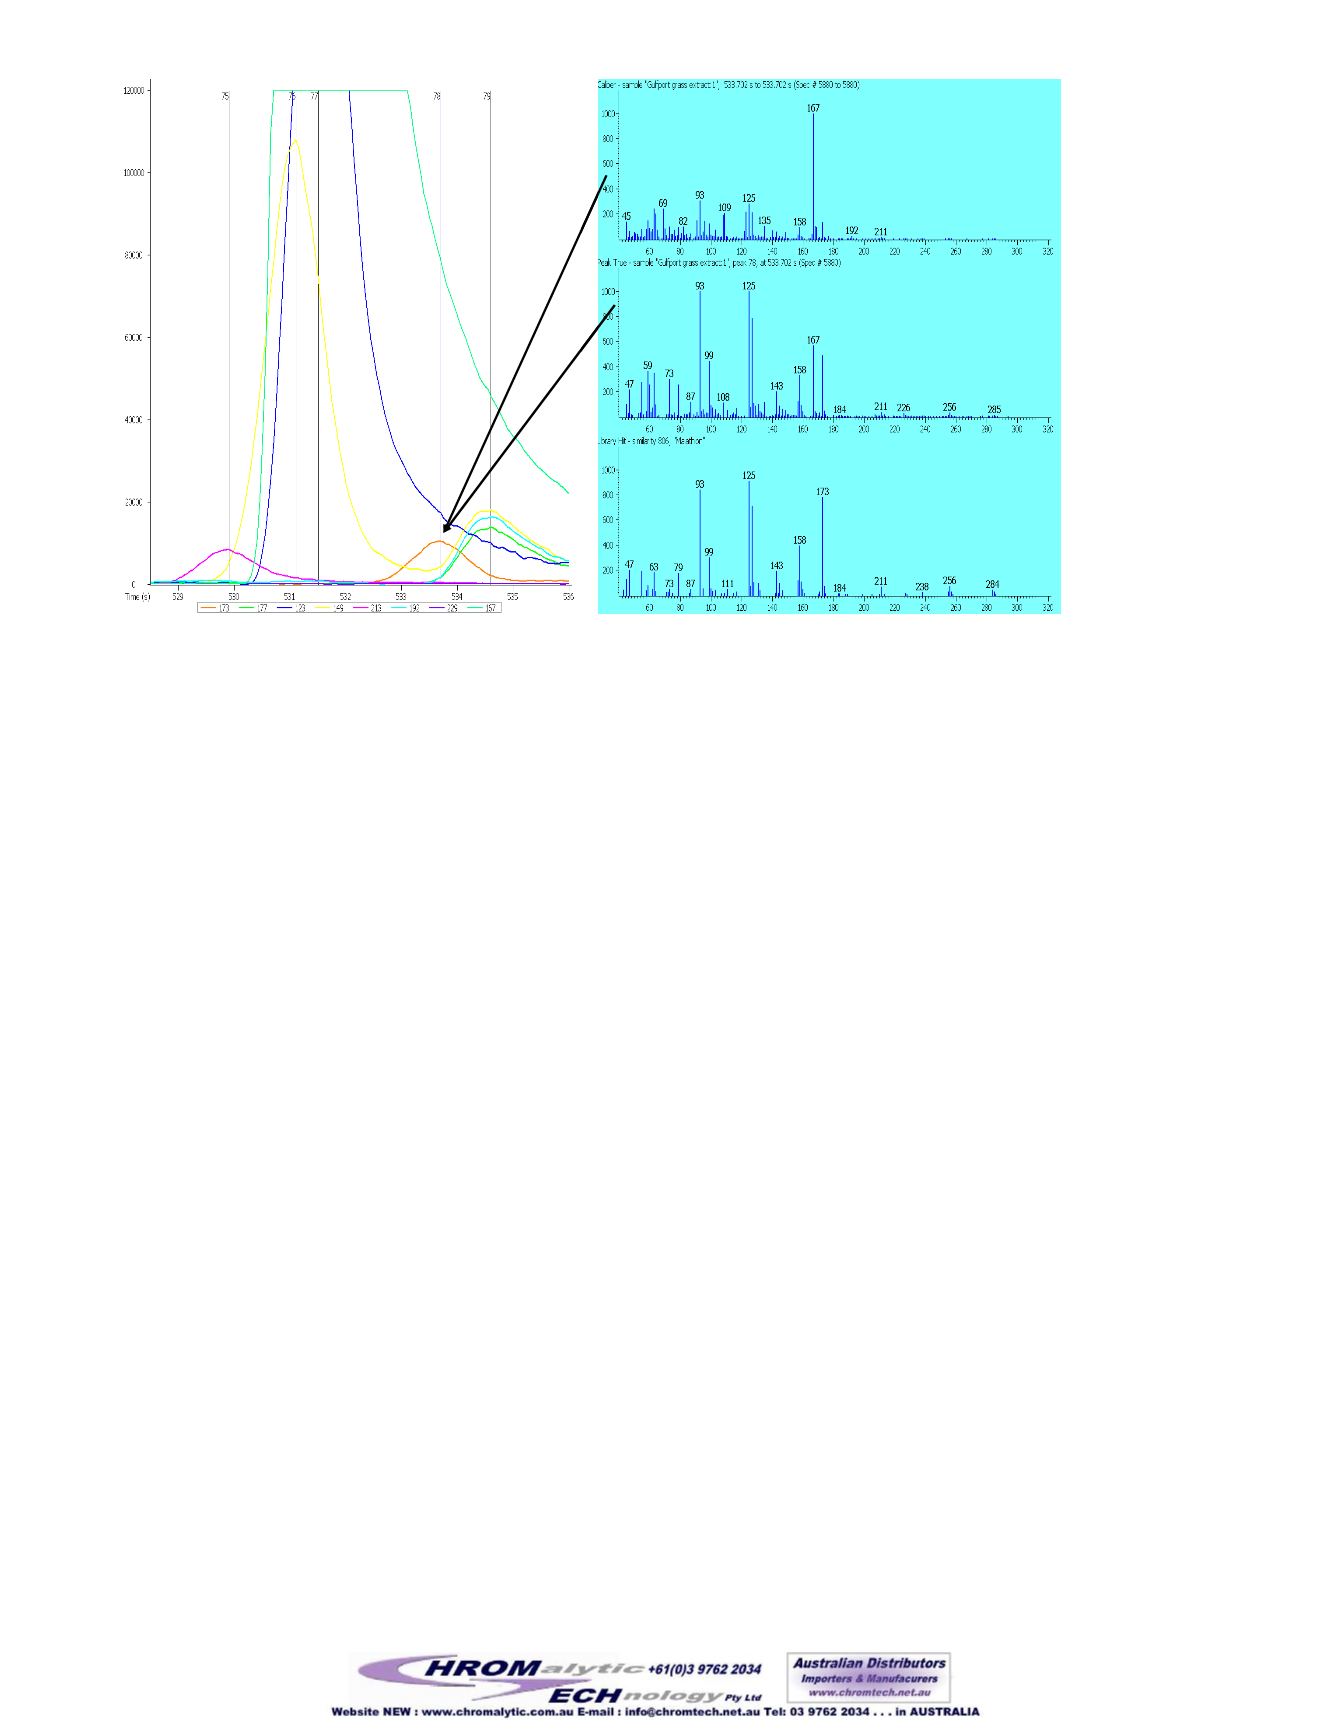
Deconvoluted
spectrum
Library
spectrum
Raw
spectrum
Figure2.
Chromatogram of 125 pgMalathion (orange peak) in an ash leaves extract plottedwith
ions representing thematrix. The raw spectrum taken at the peak apex for Malathion hardly hints
that Malathionmay be present. The deconvoluted TOFmass spectrum, even though it contains
some residual 167 ion from the hugematrix interference, matches well with a library spectrum.
Another way to tackle complex samples is to increase the chromatographic separating power by
applying GCxGC. The benefit of this approach is easily visualizedwhen viewing the contour plot, or
GCxGC chromatogram, of Figure 3. Notice how separations are now occurring in two dimensions,
one along the X-axis (Rtx-5) and the other along the Y-axis (Rtx-PCB). The potential tomove
pesticides away frommatrix interferences is substantially increased. In fact, in this example, both
Malathion and Chlorpyrifos would have coelutedwith high-concentrationmatrix interferences in a
one-dimensional analysis with Rtx-5. But the Rtx-PCB has located the pesticides away from these
interferences in the second dimension (Figure 4), resulting in the high quality, library-searchable
spectra seen in Figure 5. The similarities for both pesticides are greater than 900 (out of 999).


