FormNo. 203-821-244 01/05-REV0
LECO is a registered trademark of LECO Corporation
5
CalibrationwithGCxGC-ECD
Calibration curves were established for GCxGC-ECD by the external standardmethod using the
standard concentrations listed above. Example calibration curves for one of the better ECD
responding compounds (gamma-HCH or Lindane), and theworst responding compound
(Methoxychlor) are shown in Figures 4 and 5.
Although all of the GCxGC-ECD quantifications for the samples were performed using calibrations
established based on concentrations listed in the Standards section, it is possible to gomuch lower
due to the extreme sensitivity afforded by the ECD and the sensitivity enhancement achieved by
the focusing effect of GCxGC. Table 2 lists low points and the correlation coefficients when the
curve is further extended to even lower OCP concentrations. Again, it is important to point out that
since a split injectionwas used, some of the actual amounts on column (and to the detector) are
very low. For example, a 0.5 pg/µL standard represents 10 fg (!) on column.
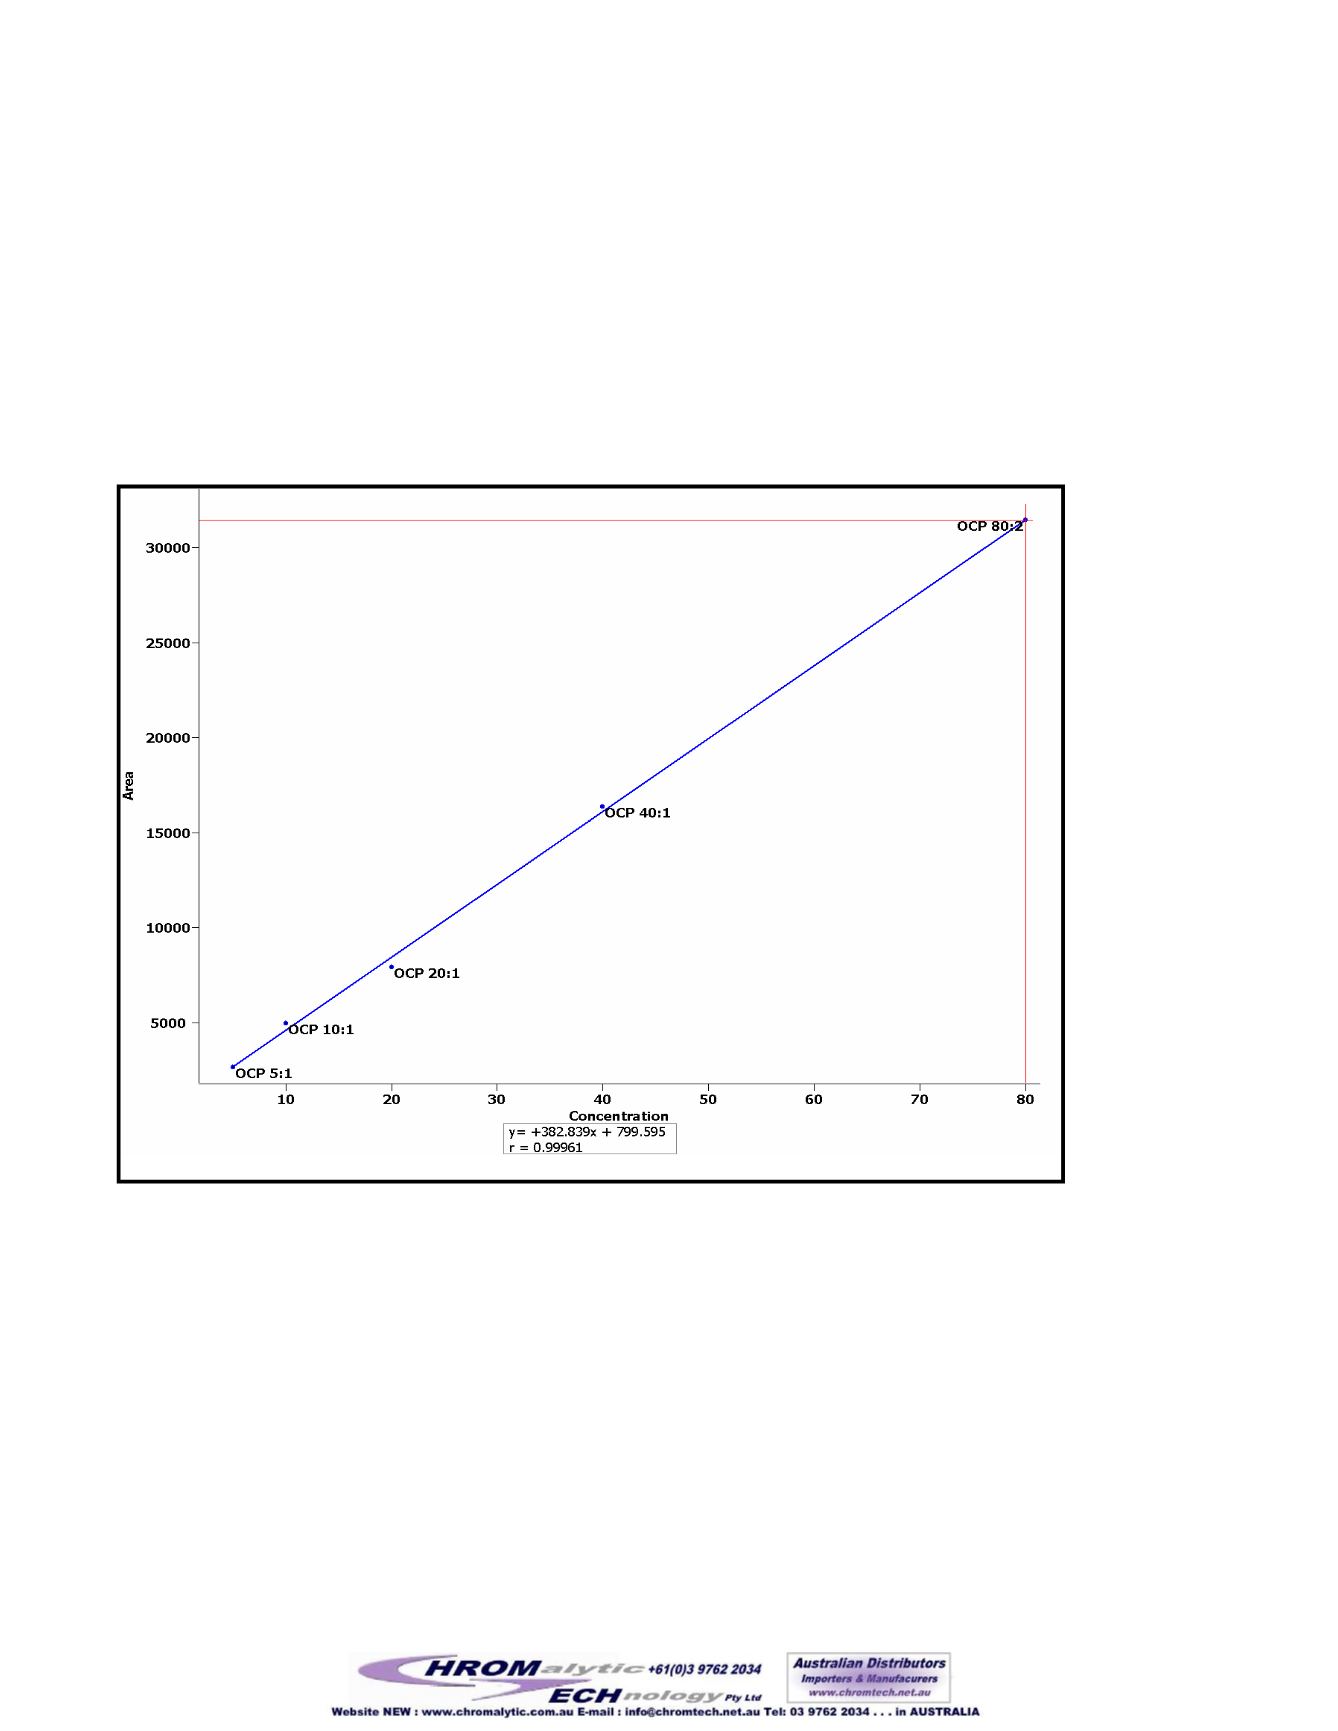
Figure4.
GCxGC-ECD calibration curve for gamma-HCH (Lindane). Note that the concentrations
are in pg/µL (listed as black numbers by the points, e.g. 5:1= 5 pg/µL), but due to split injection
at a ratio of 50:1, the low point represents only 0.1 pg on column.
5
to 80 pg/µL


