


 269 / 298

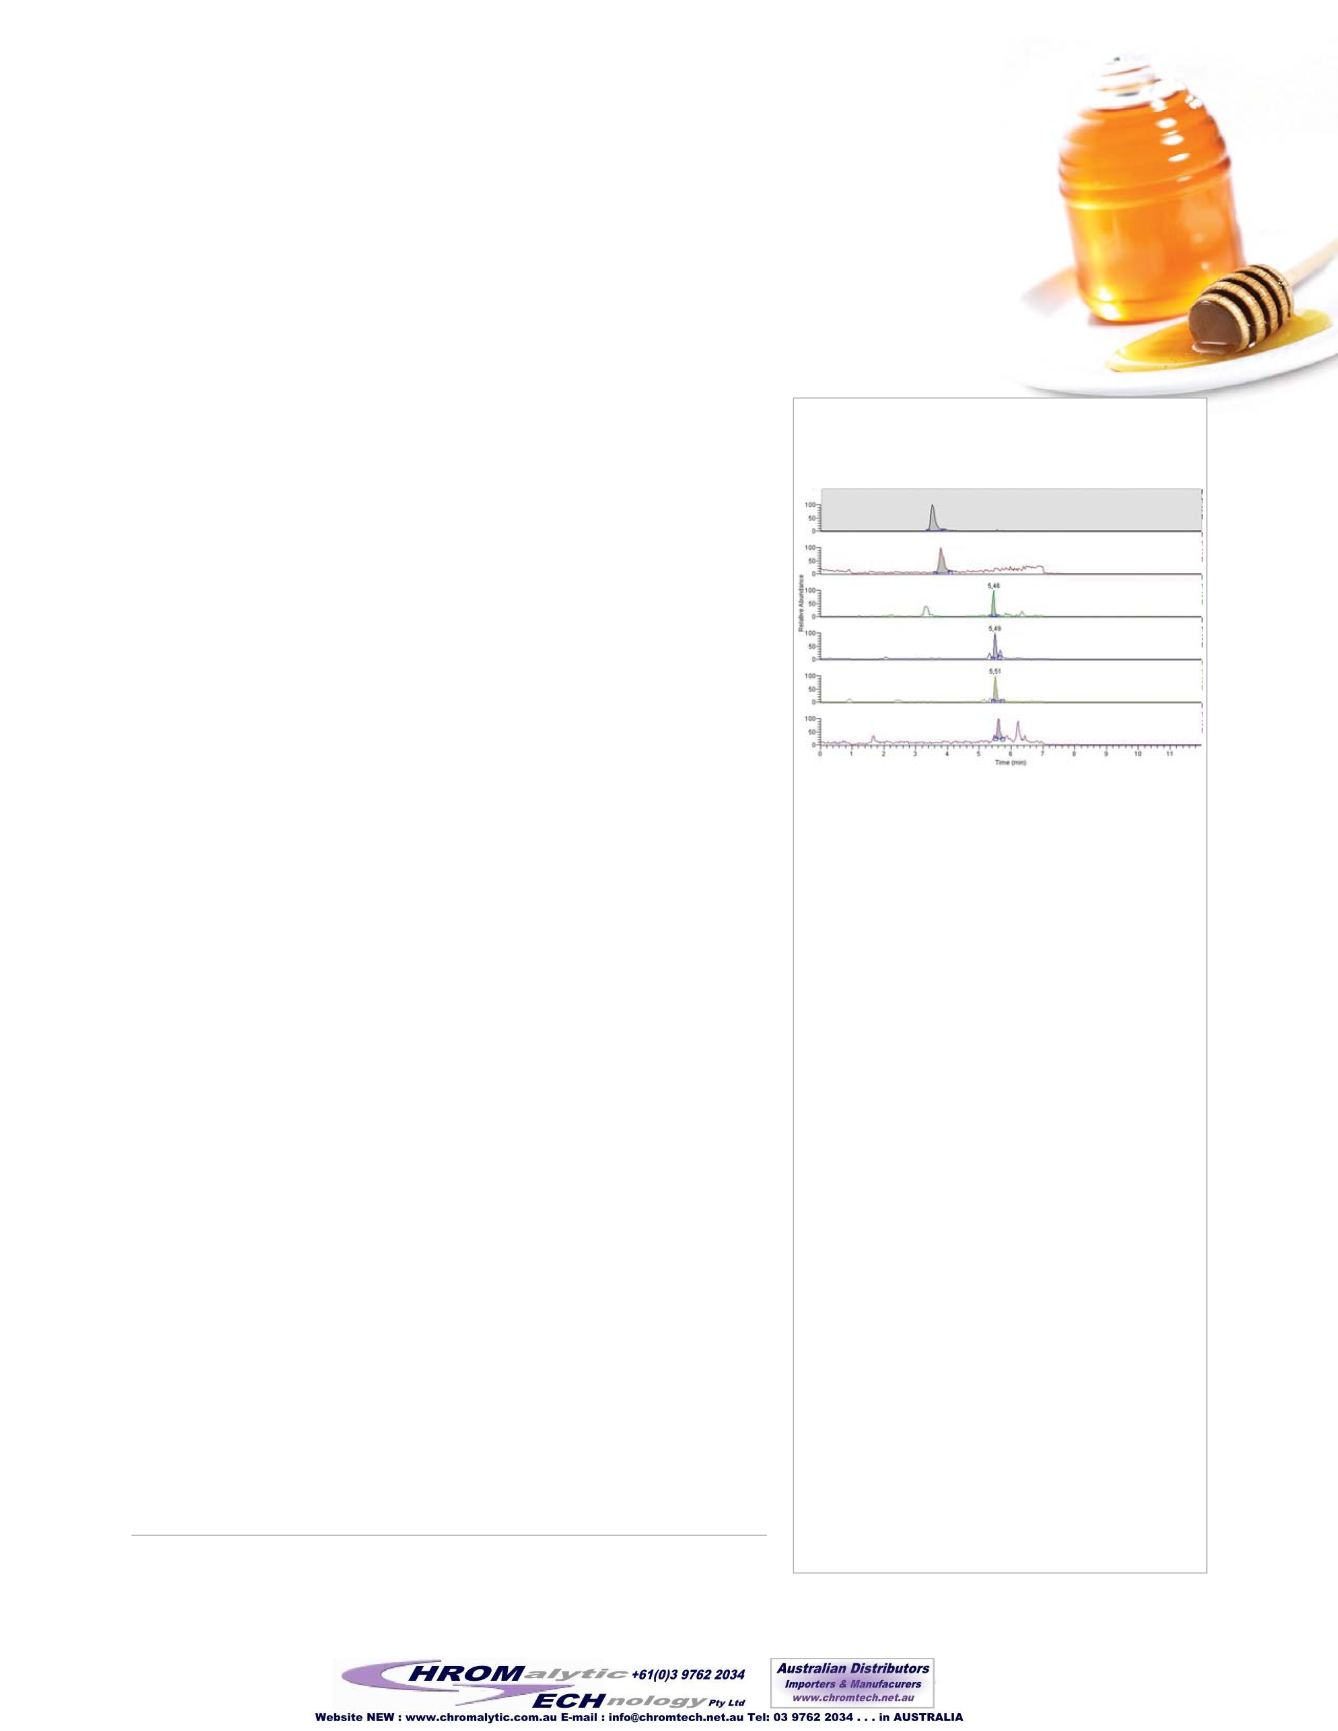
Figure 1
Nitrofuran metabolites in honey
detected at 0.3ppb by LC/MS/MS, using an
Ultra C18 column.
•
11
•
2005 vol. 2
Nitrofurans are a class of veterinary antibiotics used to increase growth rate
and prevent or treat disease in animals. Animals have been treated with antibi-
otics since the 1950s and, currently, about 45% of the antibiotics produced
each year in the U.S. are administered to livestock. In Europe, this practice is
illegal, because the inadvertent consumption of residual antibiotics in animal
tissue, such as meat or liver, can lead to increased drug resistance or allergies
in humans.
Nitrofurans have been detected not only in treated animals, but also in animal
products, including honey. The low levels of these compounds and the com-
plexity of honey as a matrix present challenges for the analysis of nitrofurans.
In addition, nitrofurans are unstable and metabolize rapidly
in vivo
. Any
analysis method for nitrofurans, therefore, must be able to separate and detect
these metabolites. In the analysis of honey, it is of interest to quantify four
nitrofurans: furazolidone, furaltadone, nitrofurazone, and nitrofurantoin,
through their respective metabolites, 3-amino-2-oxazolidone (AOZ), 5-
mofolinomethylmethyl-3-amino-2-oxazolidone (AMOZ), semicarbazide
(SC) and 1-aminhydantoin (AHD). The method of choice for the analysis of
nitrofuran and nitrofuran metabolites in honey is LC/MS/MS, with separation
on a C18 column.
In this study, honey samples treated with the four nitrofuran metabolites were
dissolved in water, then extracted with ethyl acetate. After centrifugation, the
extract was evaporated and reconstituted in 125mM HCl, then derivatized
with 2-nitrobenzaldehyde. After two liquid-liquid extractions with ethyl
acetate, the extract was evaporated and reconstituted with mobile phase, fil-
tered, and injected into the LC/MS/MS system. The column used for the
analysis was a 100 x 2.1 mm, 3µm Ultra C18 column. For maximum sensitiv-
ity and specificity, a triple quadrupole analyzer was used, with electrospray
ionization and selected reaction monitoring (SRM).
Results from the analysis of 0.3ppb nitrofuran metabolites in honey are shown
in Figure 1. The Ultra C18 HPLC column is an excellent choice for this analy-
sis. As a reliable general purpose column based on a high-purity, base-deacti-
vated silica, its utility extends to other compounds that might be present in
animal-derived matrixes, such as steroids and vitamins.
In analyses for nitrofuran antibiotics, an Ultra C18 HPLC column is an excel-
lent choice, especially for analyzing trace levels of these compounds in a com-
plex sample matrix.
Analysis of Nitrofurans in Honey
Using LC/MS/MS and an Ultra C18 Column
By Eberhardt Kuhn, Ph.D.; International Marketing Specialist; and Becky Wittrig, Ph.D., HPLC Product Marketing Manager
• Sensitive detection of antibiotic metabolites in a complex matrix.
• Ultra C18 column assures the resolution needed for the LC/MS/MS method.
• Excellent peak shape at sub-ppb levels.
Acknowledgement
We are grateful to EIDOMET SRL, Restek distributor in Argentina, and application chemist Dr. Alejandro
Albornoz, for the analytical work discussed in this article.
Data courtesy of Dr. Alejandro Albornoz, EIDOMET SRL, Buenos Aires.
Ultra C18 Column
3µm Particles, 2.1mm ID
cat. #
price
100mm
9174312
$356
For many other dimensions, refer to our catalog or visit our website.
Column:
Ultra C18
Cat. #:
9174312
Dimensions:
100 x 2.1mm
Particle Size:
3µm
Pore Size:
100Å
Conditions:
Mobile phase:
A: 0.05% formic acid in methanol
B: 0.05% formic acid –
5 mM NH
4
formate in water
Time (min) %B
0
90
2.5
90
5
10
10
10
12
90
15
90
Sample:
0.3ppb each analyte
Flow:
200µL/min.
Temp.:
30°C
Det.:
MS/MS triple quadrupoles
(Thermo Finnigan Discovery)
Analyzer Parameters:
Ion source:
ESI (electrospray ionization)
Only segment:
15 min.
Polarity:
positive
Data type:
centroid
Scan mode:
SRM product
Scan width (m/z): 0.7
Scan time (s):
0.25
Peak width:
Q1: within 0.7
Q2: 0.7
Collision gas
pressure (mTorr): 1.5 (argon)
Divert valve:
active, with 3 positions
Positions-1° 2 min., 2° 8 min., 3° 5 min.
Analyte
Prec. Ion Prod. Ion Collision E Tube Lens
AOZ
236
134
12 V
120
AMOZ
335
291
10 V
100
SC
209
166
12 V
80
AHD
249
134
12 V
110
AMOZ = 3-amino-5-morpholinomethyl-2-oxazolidinone
AHD = 1-aminohydantoin hydrochloride
ADZ = 3-amino-2-oxazolidinone
SC = semicarbazide
d5-AMOZ
(3.7min.)
AMOZ
(3.8min.)
AHD
(5.46min.)
d4-AOZ
(5.49min.)
AOZ
(5.51min.)
SC
(5.6min.)
LC_0323