substantia
the more
of wrap-ar
essential
this is gen
that the wr
don’t interf
to the next
possible t
using a fo
period to r
around, b
in the curr
the wrap-
and we ch
slice per p
maintainin
integrity.
11
The sep
MEGA-W
column is
Figure 5,
slice is pr
of the sec
is estimat
10 using t
above and
stationary
choice for
analysis of
"DLOPXM
This work
Australian
funding sc
DP077189
Dr Stefano
MEGA-WA
Narcowicz
for supplyi
oil sample.
from Reste
acknowled
3FGFSFO
R.A. S
, 189
L. Mon
136–14
R. Shel
Sep. S
R. Shel
(20),
M. Wan
1.
2.
3.
4.
5.
Rtx-WAX column. Hydrogen carrier gas was supplied at a constant pressure of 100 psi
and a temperature programme of 40–240 ºC in 6.67 min (30 ºC/min) was used. The
injection volume was 1 μL using a split ratio of 1:50.
D2 retention time
09K1204c CSV x
2.0
2.5
1.5
1.0
0.5
0.0
10
20
30
40
50
D1 retention time
5
10
15
20
25
30
35
'JHVSF
GC GC chromatogram of kunzea essential oil. Hydrogen carrier gas was
supplied at a constant pressure of 27 psi. The injection volume was 1 μL using a split
ratio of 1:50.
Common Phases Polarity Quick View
MEGA-1
MEGA-5
MEGA-13
MEGA-20
MEGA-624
MEGA-1701
MEGA-35
MEGA-17
MEGA-200
MEGA-225
MEGA-50
MEGA-WAX
MEGA-ACID (FFAP)
MEGA-10
apolar
polar
ts
91
48
97
90
94
85
0
100
% of Usage
Volatile Suspected allergens
91
97
94
FAME
48
90
85
1
2
3
Basic Performance:
Separation
Space Used
The
% of usage of the separation space
[1,2] was used
to investigate the degree of correlation between the two dimensions
on the basis of the peak distribution on the chromatographic plane.
This parameter is a practical measure of the degree of orthogonality
and indicates the ratio between the area occupied by solute
separation and the unused separation space beneath the
2
D dead
time.
Figure 3
reports the amount of separation space used referred
to volatile suspected allergens and FAME test mixtures.
The net separation space through which data were normalized, was
referred to
2
D column hold-up time (
2
D t
M
).
Experimental data show that the % of usage of the separation
space is maximized with conventional ID columns, DN-
UNIQUE
TM
or MEGA-2D
TM
, because of the improved
exploitation of the
2
D stationary phase. A fairy separation of
the suspected allergens standard mixture is reported in
Figure 4.
[1] D. Ryan, P. Morrison, P. Marriott , J. Chromatogr. A 1071 (2005) 47
[2] C. Cordero, P. Rubiolo, B. Sgorbini, M. Galli, C. Bicchi, J. Chromatogr. A 1132 (2006) 26
Capacity
to evaluate the separation
umber of peaks in a selected time
for each chromatographic dimension
umed to be four times the standard
calculated for each chromatographic
tween the first and the last eluted
st eluted
-
1
tC
first eluted
), and for the
2
D it
time, i.e.
2
Dt
=(
2
t
analysis time
- 2t
hold-up
ut modulation and keeping the other
lation period of 4 s.
d the last eluted components of
values calculated for the column set
CxGC
14
52
0
4
2D s
60
0
1D min
Figure 3
Figure 4
Target Analysis:
Precision and Linearity
OV1 - 25x0.25, 0.50
OV17 - 2.5x0.25, 0.15 (loop 1.0x0.25)
Set N°
12
CxGC
961
81
56
952
1112
4581
5056
2
3
N-UNIQUE
TM
or MEGA-2D
TM
Volatile suspected allergen quantitative determination
is part of the fragrance
quality control assessment
and
should take into account the highly variable distribution of
fragrance components and adopt experimental conditions to
compensate peak distortions due to both column overloading
and strong retention effects. Widely used orthogonal
stationary phase combinations, such as
1
D OV1/
2
D CW20M,
were not effective enough in particular with the polar analytes
affected by a strong
2
D retention due to the inappropriate
elution temperature of the
2
D column. These effects are well
overcome by the adoption of OV1701 or OV17 but the higher
correlation (low orthogonality) between the two dimensions for
the 0.25/0.10 mm ID column settings need for slower
temperature rates, and consequently, higher analysis times.
The exploitation of
2
D stationary phase selectivity showed by
0.25 mm homologous ID column combination, resulting in
significant peak spreading over the chromatographic plane,
and the higher
2
D column loadability suggested to test
DN-
UNIQUE
TM
or MEGA-2D
TM
for an effective separation of
target allergens and to evaluate if their peak capacity was high
enough to separate target analytes in a medium complexity
fragrance.
Correlation coefficients
(R
2
) estimated by regression
analyses over a 50-2 mg/L range and
precision
results
(expressed as RSD%) referred to the 2D area of each analyte
measured over six replicates, are reported in
Table 3
.
Results show that MEGA-2D
TM
OV1_OV1701
operating at controlled flow, temperature and
modulation period conditions, can successfully be used
for the target analysis of volatile suspected allergens in
medium complexity fragrance (see Figure 5).
MEGA-2D
TM
is characterized by an improved exploitation
of stationary phase selectivity and an increased 2D
column loadability; its limited net peak capacity, if
compared with an equivalent conventional column
setting limits its use to samples with medium
complexity.
0
4
2D s
60
0
1D min
Figure 5
Regression analyses R2 2D Area Precision RSD%
Component Name SIM m/z ions
Set N° 1 MEGA-2D Set N° 1 MEGA-2D
amylcinnamic aldehyde
202
, 201, 129
0.992
0.996
2.05
2.03
anisyl alcohol
138
, 137, 109
0.973
0.994
2.15
1.93
benzyl alcohol
108
, 79, 107
1.000
0.997
2.61
0.52
benzyl benzoate
105
, 212, 194
0.997
0.990
2.05
1.62
benzyl salicylate
91
, 228, 65
0.999
0.994
1.64
0.93
cinnamic alcohol
92
, 134, 115
0.980
0.999
1.37
2.60
cinnamic aldehyde
131
, 132, 103
0.991
0.998
5.54
4.59
coumarine
146
, 118, 89
0.996
0.998
2.05
3.21
farnesol isomer I
69
, 93, 81
0.986
0.999
2.15
2.15
farnesol isomer II
69
, 93, 81
0.988
0.999
2.61
2.06
geraniol
69
, 123, 93
0.991
0.998
2.05
2.05
hexylcinnamic aldehyde
216
, 215, 129
0.980
0.999
1.64
1.62
limonene
164
, 149, 131
0.999
0.998
1.37
1.36
linalool
68
, 93, 67
0.999
0.999
5.54
1.98
phenylacetaldehyde
91
, 120, 92
0.995
0.997
1.77
3.52
Table 3
s
the two
MEGA-2D
TM
or
mm homologous diameter
tationary phases in series
timal linear velocity,
applications. This unique
dimensions and, as a
ening effects.
the definition of several
get analysis approach for
m complexity fragrances.
ion were, above all, issues
GCxGC Solutions
!"# "
$ %&'(!)*# **+ ,- , ./
!"
# $%&
'(
'(
#(
(
)*+ $,*-
! " # $
%&
' ( $
)
*
+ , $
-
.+ %./%
012 0123 12
!
,*-$, $.$
$
$
/&
0$1
2
3
4
2
4
4
4
3
5
6 7
/80
/$0
/80
/$0
/80
/$0
/80
/$0
!
'
"
#
.+ 4 5 6$
9 :*+
(; # < ( #
7008 =
# (
*
; =
' ( > 1$+
+ &+ 1# (' (
' # # =
(
$#
! # % &
'
.+ 2 ' /
+ $)
(; # # (
9
(
(
''
; ' ( ; (
+ $) ;
( = '(
( ( ' #
)*+ $
) -
()
.+ 1% '
( = (; 9 < !
#
- &
' ( + &+
),+
(
?
# =
( ' < )*+ )
$+ + &+
:( % !# !#
*
*
) '$
.+ %./
@
; ( # ( +
(
#
> 1$+ # (
?
# = ( '
9
-
&&
- &
*
&&
&
:
4
Allergens std. Mix GCxGC analysis on MEGA-2D column.
Courtesy of University of Torino, Prof. C. Bicchi, Prof. C.Cordero et al.
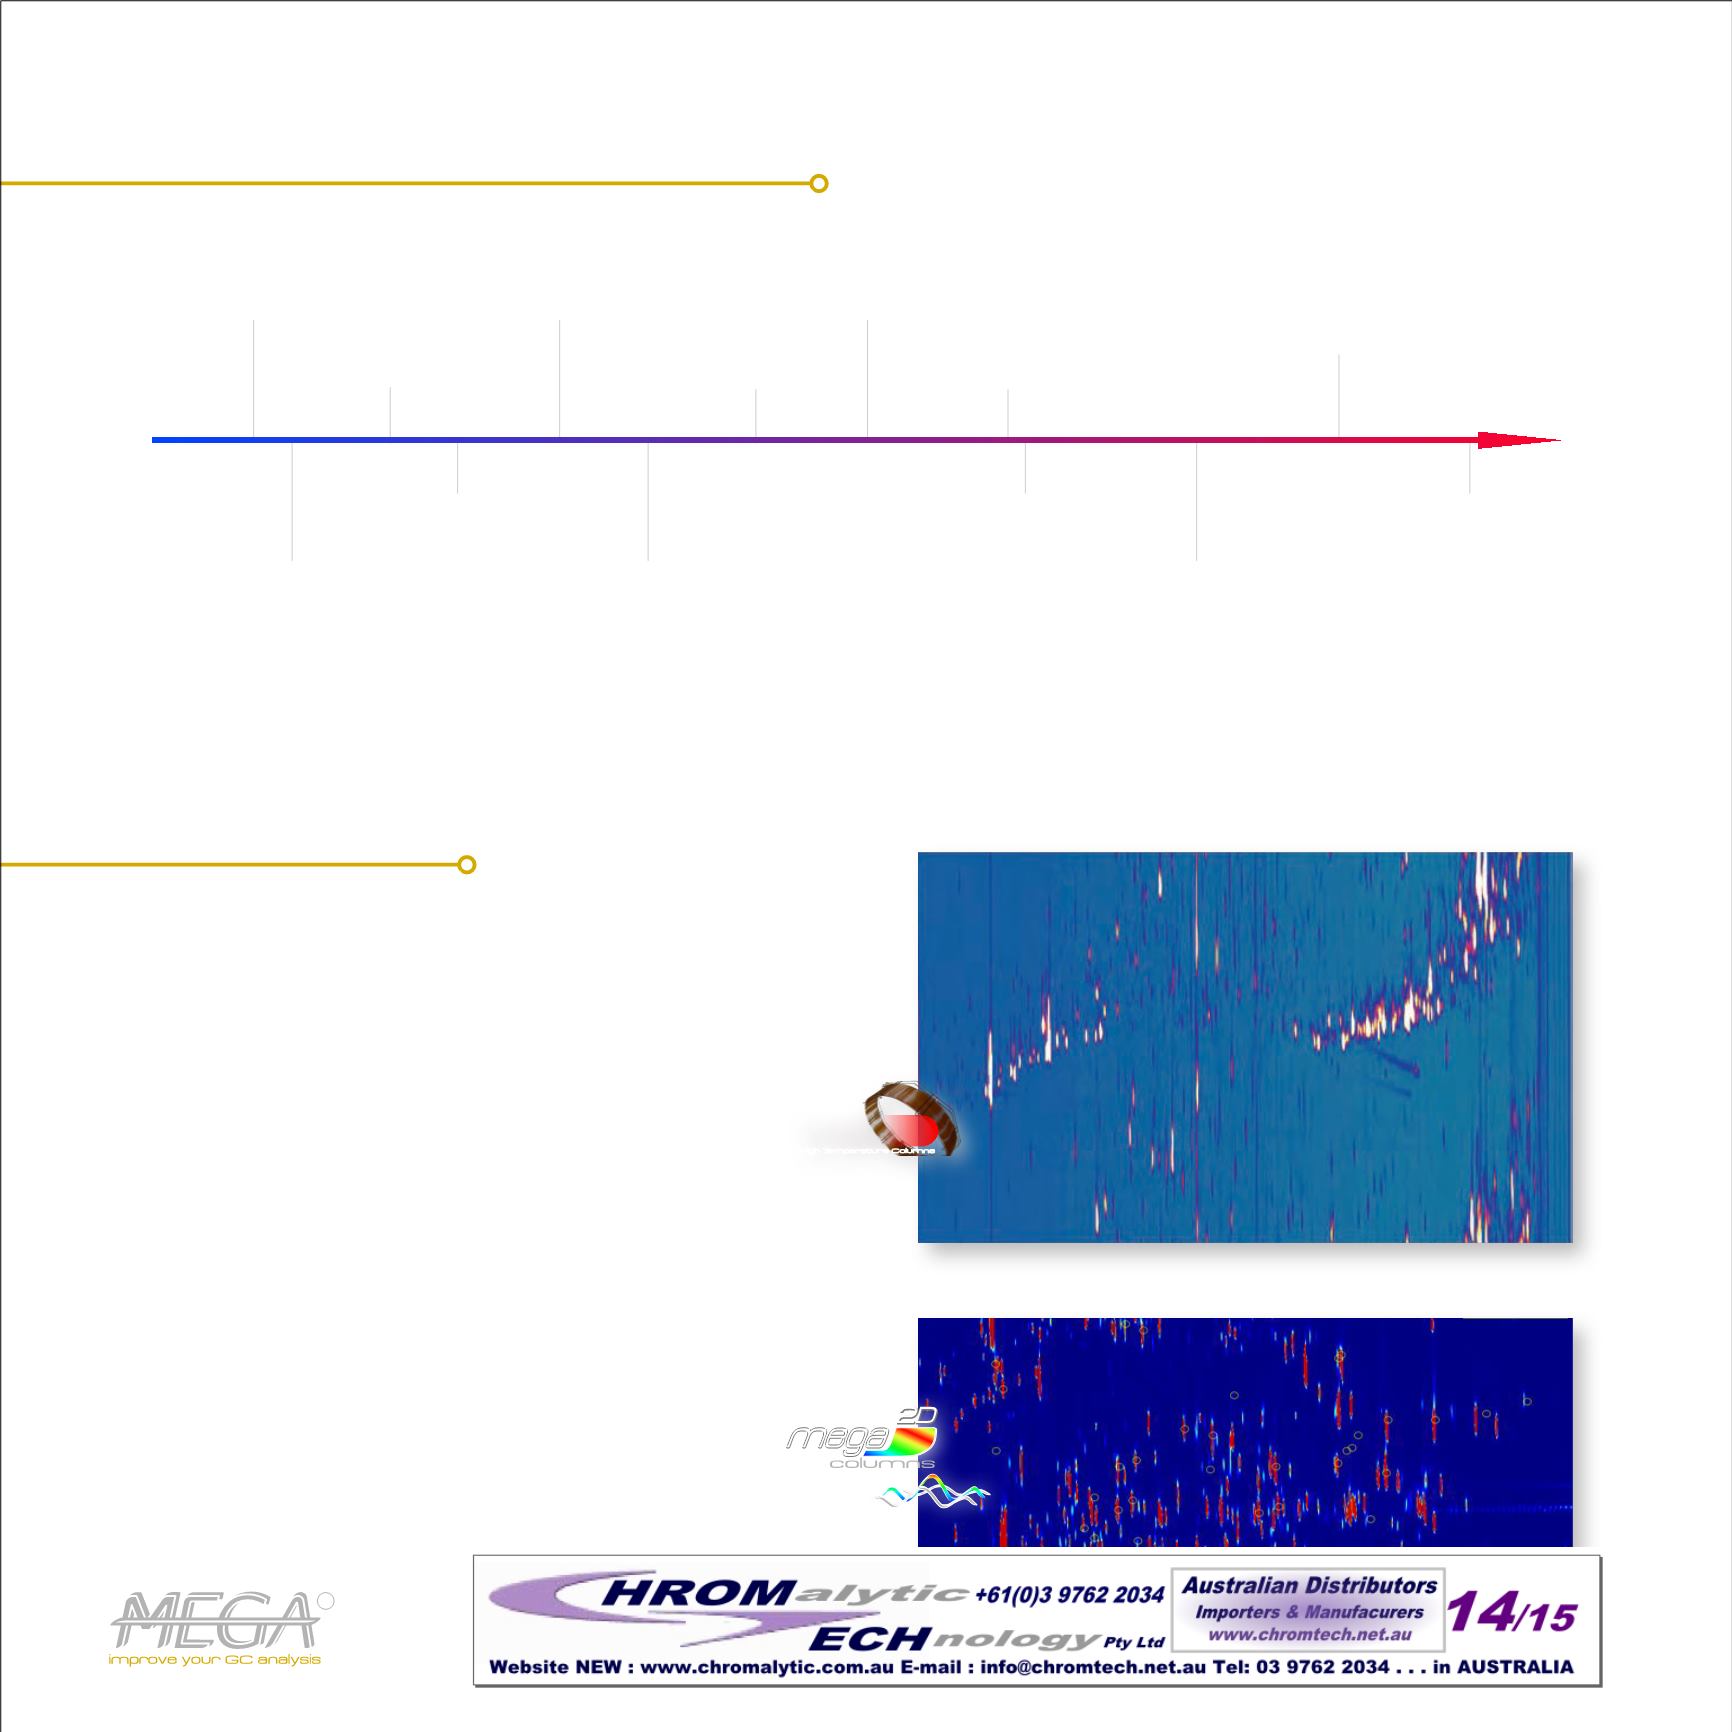
Kunzea
essential oil GCxGC analysis using MEGA-WAX HT on 2
nd
dimension.
Courtesy of R. Shellie et al.
MEGA offers u ique and innovative
products for your GCxGC analysis.
!
We can provide completely custom
GCxGC solutions, including ready-to-use
kits.
Selectivity of the stationary phase plays a
fundamental role in GC and this is even
more impor tant in GCxGC. Ask us to tune
the selectivity of the stationary phase thus
to explore new and unique solutions and
to optimize the or thogo ality and the
efficiency of your GCxGC system.


