


 5 / 12

5
visit
www.restek.com/quechersFigure 2:
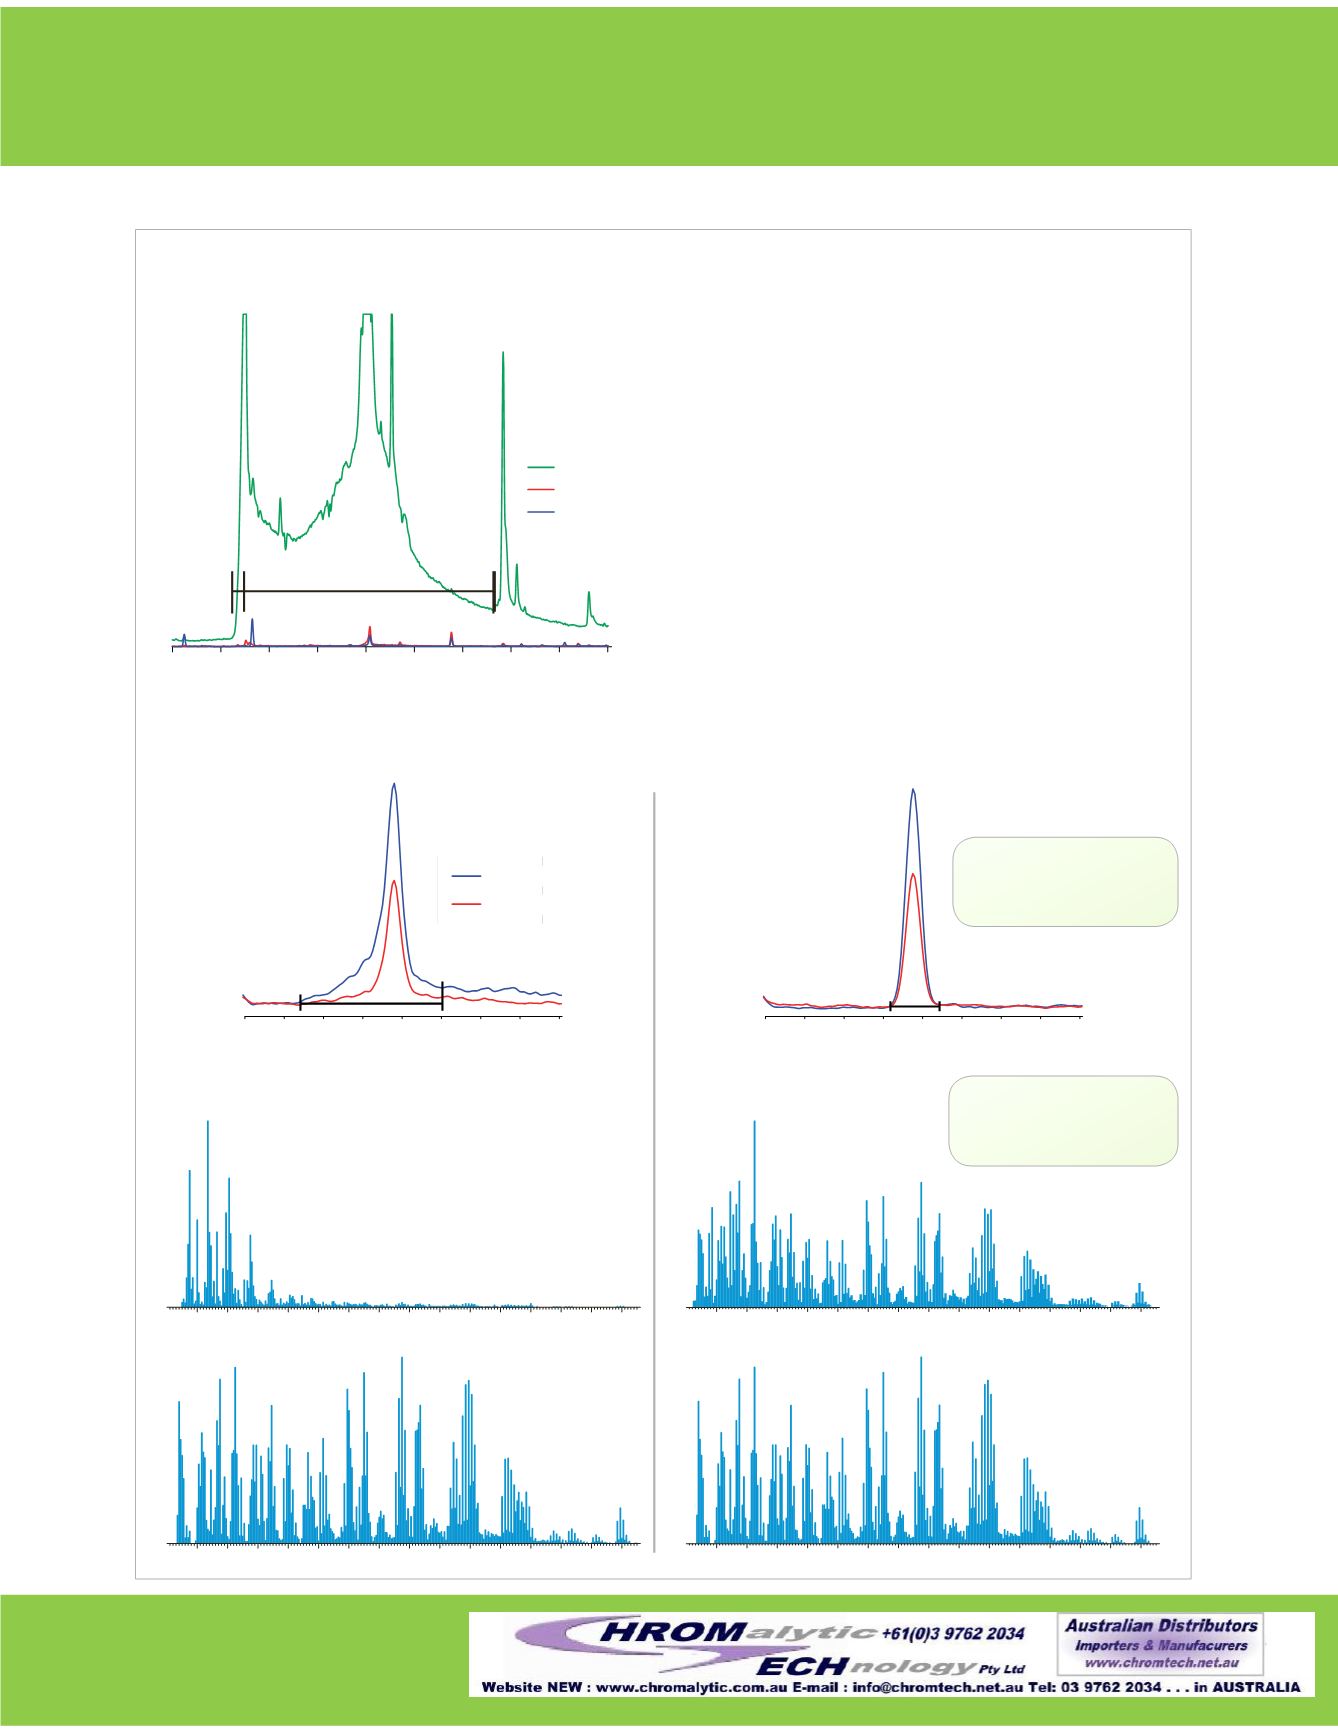
QuEChERS dSPE cleanup significantly improves quantification and identification.
520
500
540 560 580 600 620 640 660 Time (sec)
1. Hexadecanoic acid
2
= m/z 60
= m/z 195
= m/z 197
Column:
Rxi
®
-5Sil MS, 20 m, 0.18 mm ID, 0.18 μm (cat.# 43602)
Sample:
sweet potato spiked with pesticide mix, extracted with
acetonitrile and Q-sep™ QuEChERS EN Method 15662
extraction salts, then acidified with formic acid to pH 5
Inj.:
1.0 μL splitless (hold 1 min.), 4 mm single gooseneck liner
with w/wool (cat.# 22405)
Inj. temp.:
250°C
Carrier gas:
helium, constant flow
Flow rate:
1.2 mL/min.
Oven temp.:
72.5°C (hold 1 min.) to 350°C @ 20°C/min.
Det:
TOFMS
Transfer line temp.:
225°C
Scan range:
45-550 amu, m/z 60, 195, 197 plotted
Ionization:
EI
Instrument:
Agilent 6890, LECO Pegasus III
GC_FF1222
60 80 100 120 140 160 180 200 220 240 260 280 300 320 340
67
55
81
60
73
95
109
121
150
195
171
280
237
207
265
195
85
170
75
239
159
48
207
109
63
143
119
99
133
265
277
339
181
216
307
295
323
60 80 100 120 140 160 180 200 220 240 260 280 300 320 340
75
57
195
237
207
109
63
48
170
121 143
265
339
183
216
307 325
48
195
85
85
170
75
239
159
207
109
63
143
119
99
133
181
216
265
277
339
307
295
323
60 80 100 120 140 160 180 200 220 240 260 280 300 320 340
60 80 100 120 140 160 180 200 220 240 260 280 300 320 340
576
574
578 580 582 584 586 588 Time(s)
m/z 195
m/z 197
1
576 578
574
580 582 584 586 588 Time(s)
1
A. No extract cleanup
Sample spectrum with no extract cleanup
Endosulfan I
reference spectrum
Sample spectrum with
QuEChERS dSPE cleanup
Endosulfan I
reference spectrum
B. Q-sep™ QuEChERS
cleanup
Without cleanup, matrix masks Endosulfan I.
QuEChERS dSPE cleanup improves quantification and identification.
Peak Integration (extracted ion chromatograms)
Better peak shape
results inmore accurate
quantification.
QuEChERS dSPE cleanup
improves mass spectral
library matches.
GC_FF01134
GC_FF01133
Spectral Identification
Peak List
1. Hexadecanoic acid
2. Endosulfan I
m/z 60
= m/z 195
m/z 197
= m/z 195
= m/z 197